filmov
tv
Intro Stats, Lec 5B, Correlation & Regression (& application to Joe Mauer's Baseball Statistics)

Показать описание
(0:00) Will be quickly going over a lot of material.
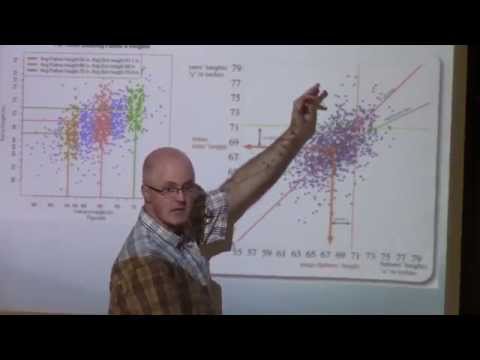
(0:43) Scatterplots for Joe Mauer, his Home Run totals and Batting Averages per season. Either could be the explanatory variable and either could be the response variable. The correlation is the same either way.
(1:44) Summary of correlation facts.
(2:33) Mathematica demonstration of how changing the viewing window might seem to change the correlation, but it doesn't.
(4:55) More properties about correlation.
(6:09) Formulas for finding the slope and intercept of a regression line. Keep track of order of operations.
(8:14) Facts about least squares regression lines. Include discussion of general linear equations and how to find the change in y ("delta y") when you know the slope and the change in x ("delta x"). This is key to interpreting the slope as a rate of change. Include a discussion of the coefficient of determination and how it measures the strength of the linear relationship.
(13:50) What's the regression line used for?
(16:01) Regression lines on a spreadsheet for Joe Mauer's data about home runs and batting averages. Use the equations for estimation/prediction. Interpret the slope.
(22:41) Warning: swapping the variables and finding the new regression line is NOT the same as finding the inverse function of the original.
(23:50) Residuals and residual plots.
(26:24) Cautions about correlation and regression.
(27:18) Read about sampling techniques, especially simple random sampling. Will be using a table of random digits.
AMAZON ASSOCIATE
As an Amazon Associate I earn from qualifying purchases.
 0:28:07
Intro Stats, Lec 5B, Correlation & Regression (& application to Joe Mauer's Baseball St...
 0:03:11
Intro Stats, Lec 5A (cntd), Finish Correlation on Spreadsheet, Find Correlation on TI Calculator
 0:33:26
Intro Stats, (most of) Lec 5A, Grading on a Curve, Correlation on a Spreadsheet, Joe Mauer Stats
 0:07:18
Introduction to sampling distributions | Sampling distributions | AP Statistics | Khan Academy
 0:02:34
Linear Regression in 2 minutes
 0:13:29
Video 1: Introduction to Simple Linear Regression
 0:27:22
Intro Stats, Lec 23B, Review Chi-Square Test, SS Regression formulas, Use XL Miner for Regression
 0:13:23
Introduction to Correlation Lec 01
 0:05:54
L12.5 Covariance
 0:32:47
Intro Stats, Lec 27B, Interpret r^2, ANOVA, Intro to Multiple Regression, Review for Final Exam
 0:31:03
Intro Stats, Lec 26B, Review Regression Formulas, ANOVA Spreadsheet Output
 0:14:34
ANOVA - Introduction | One Way ANOVA | Statistics | Engineering Maths 4 | Lec 5 |
 0:19:01
Types of correlation & what is correlation coefficient: Correlation and Regression part-1
 0:23:41
Intro to Hypothesis Testing in Statistics - Hypothesis Testing Statistics Problems & Examples
 0:30:10
Intro Statistics, Lec 8A, Regression Line vs SD Line, Sampling Distributions, RANDBETWEEN Simulation
 0:30:24
Intro Statistics, Lec 24B, Regression Model Standard Error, Estimating the Population Slope
 0:07:03
L12.8 The Correlation Coefficient
 0:03:28
Correlation coefficient solve by short method ch 7 lec 5
 0:01:56
What is Statistics?
 0:10:09
Lec 1G: Summary Statistics: Covariance and correlation
 0:31:36
Intro Statistics, Lec 25A, Chi-Square Test vs. z-Test for Proportions, Home Values Regression
 0:05:32
Random variables | Probability and Statistics | Khan Academy
 0:00:49
🔥 Is Doing CA Worth IT (2022) | By Aman Gupta | Shark Tank 🔥
 0:44:19
Lec 26: Correlations
Комментарии