filmov
tv
Warehouse and Products Sales Management Dashboard, with a products search field | MS Excel | #1

Показать описание
Warehouse & Product Sales Management Dashboard - Dynamic Excel Solution
Courses & Playlists:
0:00, Dashboard Features & Contents Overview
1:20, Dashboard Database
2:09, Create Pivottables
2:38, Insert and Modify the Slicers
6:33, Background Design
7:20, Arranging the slicers
9:48, Add Search bar to the slicers
13:17, Slicer Connections with the pivot tables
14:19, Add Dashboard Title & Logo
15:27, Design Buttons with Hyperlinks
20:40, Main values on the top of the dashboard
23:30, Purchased Quantity per year chart
30:17, Sold Quantity per year chart
36:29, Insert 3D icons
Take control of your inventory and sales data with the Warehouse and Product Sales Management Dashboard, an advanced Excel Dashboard from Other Levels. Designed for warehouses, retail businesses, and sales managers, this tool simplifies data tracking, analysis, and decision-making with its powerful features and interactive visualizations.
Comprehensive Inventory Insights
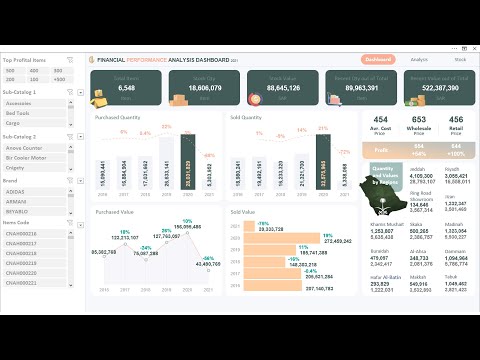
This dashboard allows you to monitor essential metrics like Total Items, Stock Quantity, Stock Value, and more. Gain clarity on Recent Values and Quantities out of total stocks for efficient inventory management. Track year-by-year trends for Purchased Quantities, Sold Quantities, and their corresponding values, including difference percentages to identify growth opportunities.
Interactive and Filterable Features
Enjoy advanced interactivity with Five Slicers for filtering data by Top Profit Products, Categories, Brands, and Product Codes. A built-in Search Bar ensures easy navigation, allowing you to focus on the metrics that matter most.
Dive deeper into your product performance with analytics for individual items. Track Average Cost Price, Wholesale Price, and Retail Price per product. Use List View Analytics and Product Rankings to identify top-performing products and areas that need improvement.
Regional Analysis and Comparative Metrics
Visualize sales and inventory data across different regions to enhance distribution strategies. Compare year-on-year Quantities and Values to understand trends and improve sales strategies effectively.
Perfect for businesses of any size, this Excel Dashboard offers unmatched flexibility and precision. Its dynamic slicers, detailed analytics, and user-friendly design make it an indispensable tool for optimizing warehouse operations and boosting sales performance Manage and analyse several warehouses and up to 250K products. With a multiple search fields to let you search and find your products easily.
Key Features
Five slicers (top profit products, 1st Sub category, 2nd Sub category, Brands, product codes)
Search bar to the slicers
Total Items, Stock Qty, Stock Value, Recent Value out of Total, and Recent quantity out of Total
Purchased Quantity by years
Sold Quantity by years
Purchased Value by years and difference percentages
Sold Value by years and difference percentages
Quantity and Values by Regions
Per Product (Average Cost price, Wholesale price, and Retail price)
Analytics for products—List view
------------------------------------------------------------
Welcome to Other Level’s,
Your go to resource for unlocking the full potential of Microsoft Office.
Whether you're looking to enhance your skills in Excel, Word, PowerPoint, or data analysis, we simplify complex tools with clear, easy to follow tutorials.
Master Microsoft Office with Step by Step Tutorials and Expert Tips!
What sets us apart:
- Comprehensive breakdown of essential formulas, digital designs, and data visualization techniques.
- Straightforward, impactful videos focused on real world business applications.
- We create professional dashboards that help you elevate your productivity and projects.
- No unnecessary jargon just relevant content that helps you master Microsoft tools efficiently.
- Honest, relevant titles and thumbnails that reflect the value we deliver in every video.
Join us and transform the way you work with Microsoft Office.
Every second of our content is designed to help you succeed!
Copyright © 2025 Other Level's. All rights reserved.
"Any illegal reproduction of this content in any form will result in immediate action against the person concerned."
#Excel #Dashboard #Financial_Performance_Analytics
Courses & Playlists:
0:00, Dashboard Features & Contents Overview
1:20, Dashboard Database
2:09, Create Pivottables
2:38, Insert and Modify the Slicers
6:33, Background Design
7:20, Arranging the slicers
9:48, Add Search bar to the slicers
13:17, Slicer Connections with the pivot tables
14:19, Add Dashboard Title & Logo
15:27, Design Buttons with Hyperlinks
20:40, Main values on the top of the dashboard
23:30, Purchased Quantity per year chart
30:17, Sold Quantity per year chart
36:29, Insert 3D icons
Take control of your inventory and sales data with the Warehouse and Product Sales Management Dashboard, an advanced Excel Dashboard from Other Levels. Designed for warehouses, retail businesses, and sales managers, this tool simplifies data tracking, analysis, and decision-making with its powerful features and interactive visualizations.
Comprehensive Inventory Insights
This dashboard allows you to monitor essential metrics like Total Items, Stock Quantity, Stock Value, and more. Gain clarity on Recent Values and Quantities out of total stocks for efficient inventory management. Track year-by-year trends for Purchased Quantities, Sold Quantities, and their corresponding values, including difference percentages to identify growth opportunities.
Interactive and Filterable Features
Enjoy advanced interactivity with Five Slicers for filtering data by Top Profit Products, Categories, Brands, and Product Codes. A built-in Search Bar ensures easy navigation, allowing you to focus on the metrics that matter most.
Dive deeper into your product performance with analytics for individual items. Track Average Cost Price, Wholesale Price, and Retail Price per product. Use List View Analytics and Product Rankings to identify top-performing products and areas that need improvement.
Regional Analysis and Comparative Metrics
Visualize sales and inventory data across different regions to enhance distribution strategies. Compare year-on-year Quantities and Values to understand trends and improve sales strategies effectively.
Perfect for businesses of any size, this Excel Dashboard offers unmatched flexibility and precision. Its dynamic slicers, detailed analytics, and user-friendly design make it an indispensable tool for optimizing warehouse operations and boosting sales performance Manage and analyse several warehouses and up to 250K products. With a multiple search fields to let you search and find your products easily.
Key Features
Five slicers (top profit products, 1st Sub category, 2nd Sub category, Brands, product codes)
Search bar to the slicers
Total Items, Stock Qty, Stock Value, Recent Value out of Total, and Recent quantity out of Total
Purchased Quantity by years
Sold Quantity by years
Purchased Value by years and difference percentages
Sold Value by years and difference percentages
Quantity and Values by Regions
Per Product (Average Cost price, Wholesale price, and Retail price)
Analytics for products—List view
------------------------------------------------------------
Welcome to Other Level’s,
Your go to resource for unlocking the full potential of Microsoft Office.
Whether you're looking to enhance your skills in Excel, Word, PowerPoint, or data analysis, we simplify complex tools with clear, easy to follow tutorials.
Master Microsoft Office with Step by Step Tutorials and Expert Tips!
What sets us apart:
- Comprehensive breakdown of essential formulas, digital designs, and data visualization techniques.
- Straightforward, impactful videos focused on real world business applications.
- We create professional dashboards that help you elevate your productivity and projects.
- No unnecessary jargon just relevant content that helps you master Microsoft tools efficiently.
- Honest, relevant titles and thumbnails that reflect the value we deliver in every video.
Join us and transform the way you work with Microsoft Office.
Every second of our content is designed to help you succeed!
Copyright © 2025 Other Level's. All rights reserved.
"Any illegal reproduction of this content in any form will result in immediate action against the person concerned."
#Excel #Dashboard #Financial_Performance_Analytics
 0:38:15
Warehouse and Products Sales Management Dashboard, with a products search field | MS Excel | #1
 0:21:05
Warehouse and Products Sales Management Dashboard, with a products search field | MS Excel | #2
 0:00:18
Excel Inventory Management Template
 0:17:25
Retail Business Manager Pro (multiple warehouse locations) Excel Template
 0:11:36
Inventory Management in 11 minutes
 0:08:48
Important KPIs for Warehouse and Inventory Management
 0:10:46
Processes of Warehousing | 5 Primary Warehouse Key Processes | Complete Explanation in A Simple Way!
 0:00:12
Part 1 of inside eShipper+: Inbounds 🚚 📦 #shipping #warehouse #ecommerce #smallbiz #logistics
 0:05:26
How To Create And Set Up Warehouses Of Products And Assets
 0:06:00
Stock Control Sheet In Excel | Inventory Management | Inventory Control Sheet In Excel
 0:00:11
Free Inventory management tools #inventorymanagementsoftware #ecommercebusiness #business
 0:03:01
How to Analyze Sales Data in Warehouse Management
 0:06:12
7 tips for warehouse inventory management
 0:04:53
Stock In Out and Balance Template in Excel | Inventory Management Template
 0:07:55
Inventory Control Methods - 11 Common Ways of Managing Your Products and Ordering
 0:07:33
Live Tour of a Real Warehouse Management System | LaceUp WMS
 0:01:18
Warehouse Operations, Product Demand, Dan and Lydia, Professional English Conversation for Business
 0:00:56
How do I monitor inventory in Excel? #exceltips #exceltutorial
 0:01:20
Stock and Inventory Online - App for Small Business Management - Track Sales, Purchases and Expenses
 0:00:42
Warehouse trick for Excel #shorts
 0:16:06
EASILY Make an Inventory Management System in Excel + Free Template
 0:00:30
Inventory management and Tracking in excel #exceltips #exceltutorial #productivity
 0:02:29
Inventory Basics - Whiteboard Wednesday
 0:02:57
Warehouse Inventory Management: How it Works and Why it's Important
Комментарии