filmov
tv
How to Graph the Equation y = 3x - 6

Показать описание
In this video we'll draw the graph for y = 3x - 6. You may also see this written as f(x) = 3x - 6.
First, we will use a table of values to plot points on the graph. Once we have two or three points, we can draw our line for the linear equation. You can choose any values of x for your table, however, 0, 1, and -1 are often best since they result in point that will fit on your graph paper.
We can also use the slope intercept form to draw the graph. Here we use the general format y=mx + b (sometimes written y=mx + c).
b tells us where the graph crosses the y axis. That gives us our first point for the graph.
m is the slope. We can use the slope to find the rise over run. For whole numbers, like 3, we consider that to be 3/1. So we go up 3 on the y axis and over 1 on the x axis. We can do that as many times as we need to in order to draw an accurate line.
I prefer to use the slope intercept formula since it is much quicker with some practice. Then I’ll plug some values into y = 3x - 6 to make sure they fall on the line. If they don’t there is likely a problem.
When graphing equations it is helpful to have them in slope intercept form (y = mx + b), just like we have in this video.
 0:05:15
Solving Systems of Equations By Graphing
 0:13:05
How To Graph Equations in Algebra
 0:04:53
Graphing a linear equation by rewriting from standard form to slope intercept form
 0:07:32
Learn how to graph a quadratic
 0:06:56
Graphing in Algebra: Ordered Pairs and the Coordinate Plane
 0:10:14
Algebra Basics: Graphing On The Coordinate Plane - Math Antics
 0:03:46
How to Graph Lines in Slope Intercept Form (y=mx+b)
 0:13:10
Graphs of linear equations | Linear equations and functions | 8th grade | Khan Academy
 0:10:52
Solving Systems of Linear Equations By Graphing │Algebra
 0:04:47
Graphing Equations in Standard Form
 0:10:05
How To Find The Equation of a Line From a Graph | Algebra
 0:05:33
Learn to graph a line in slope intercept form
 0:09:35
How To Find The Equation of a Quadratic Function From a Graph
 0:00:46
How to draw graph of the Linear Equation y=2x+3 #math #tutor #mathtrick #learning #shorts #graph
 0:05:57
Drawing Linear Graphs
 0:05:22
Solving a linear system of two equations by graphing
 0:02:09
Writing the equation from a graph
 0:32:05
Linear Equations - Algebra
 0:02:18
Graph an equation with a negative fractional slope
 0:12:00
Understand How to Graph Lines in 10 min (y=mx + b)
 0:10:04
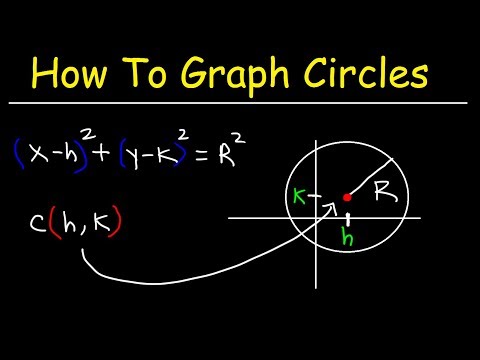
Graphing Circles and Writing Equations of Circles In Standard Form - Conic Sections
 0:04:55
How do find the x and y intercepts and graph
 0:04:28
GCSE Maths - How to Find the Equation of a Straight Line (y = mx + c) #68
 0:03:48
Graphing Lines using Slope and Y-Intercept
Комментарии