filmov
tv
Use the Analysis Toolpak to Create a Pareto Chart

Показать описание
How to create a Pareto Chart with the Data Analysis Toolpak. There are some limitations (as mentioned in the video) to creating a Pareto this way so I have another video "Create a Pareto Chart" that show it with formulas.
📝 This description may contain affiliate links and we'll receive a small commission if a purchased is made using the links (but at no additional cost to you). It'll support the channel and so more videos like this can be made. Thanks for your support!
#excel
#msexcel
#doughexcel
📝 This description may contain affiliate links and we'll receive a small commission if a purchased is made using the links (but at no additional cost to you). It'll support the channel and so more videos like this can be made. Thanks for your support!
#excel
#msexcel
#doughexcel
 0:09:49
Excel Data Analysis ToolPak - Why You Should Be Using It
 0:09:30
Data Analysis Using Excel Analysis ToolPak - Statistical tools and Methods in Practical Research
 0:01:43
How to Add the Data Analysis ToolPak in Excel | Installing Analysis Tool for Statistical Analysis
 0:04:16
Use the Analysis Toolpak to Create a Descriptive Statistics Table
 0:01:39
How to Explore the Analysis Toolpak in Excel
 0:01:59
How to Activate Analysis ToolPak in Microsoft Excel
 0:02:05
How to Install the Data Analysis ToolPak in Microsoft Excel
 0:04:24
Descriptive Statistics in Excel with Data Analysis Toolpak
 0:04:57
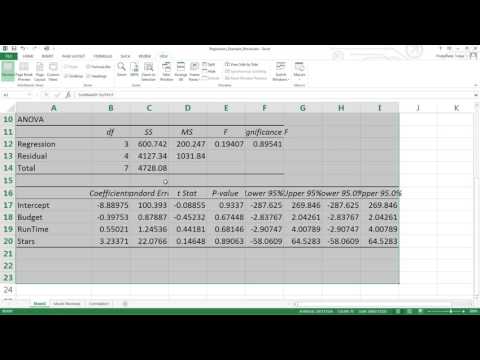
Excel Regression Analysis through the Toolpak
 0:10:41
How to do Linear Regression with Excel Data Analysis Toolpak
 0:01:39
Use the Analysis ToolPak to perform complex data analysis -Excel #Statistical #Analysis #ToolPak
 0:18:58
Build your first Machine Learning Model in Excel using the Analysis Toolpak
 0:05:52
Use the Analysis Toolpak to Create a Pareto Chart
 0:07:33
Summary Statistics and Correlation Analysis in Excel Analysis ToolPak
 0:03:32
Using the Data Analysis Toolpak in Excel to compute descriptive statistics of a numeric variable
 0:00:26
Data Analysis with ToolPak in Excel #shorts #youtubeshorts
 0:04:17
Use the Analysis Toolpak to Create a Moving Average
 0:04:03
T-test and F-test in Excel using the Data Analysis Toolpak add-in
 0:01:18
How to install Analysis Toolpak in Excel Online Very Quick
 0:01:01
Adding the Analysis Toolpak for Mac Excel
 0:03:21
Calculate Simple Moving Average using Data Analysis Toolpak in Excel - Office 365
 0:01:37
Activating Analysis ToolPak in Microsoft Excel || Data Analysis in MS Excel
 0:02:14
How to Find the Mean and Enable the Data Analysis Toolpak in Excel
 0:00:13
Install Data Analysis ToolPak in Excel #youtubeshorts #shorts
Комментарии