filmov
tv
How to learn Python for Data Analysis
Показать описание
Learning Python for data feels like drinking from a fire-hose, right? You open Google, type “best Python resources,” and a 10-mile scroll of tutorials, frameworks, and buzzwords spills out.
Breathe. You don’t need 99 % of it to land your first analyst gig.
This carousel breaks down the only five libraries I teach my boot-camp students when the goal is “get hired ASAP.”
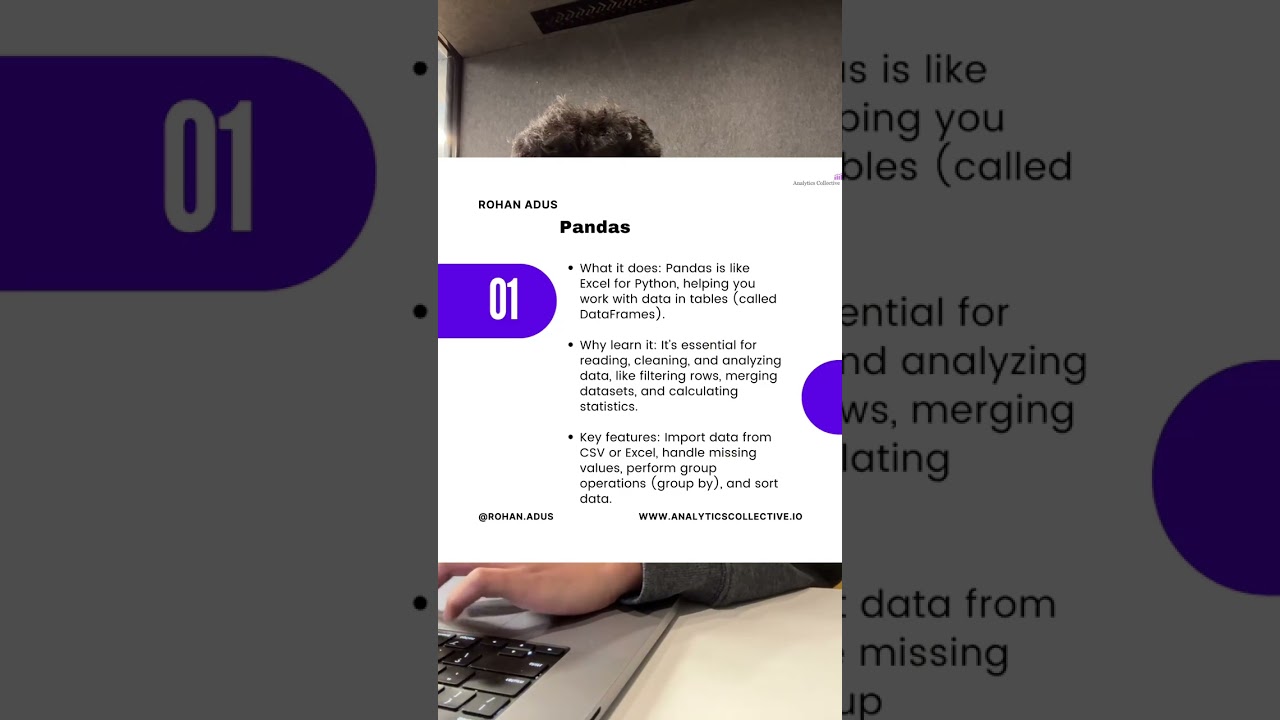
1️⃣ Pandas – Excel on steroids. Read a CSV, clean up the mess, join tables, spit out insights.
2️⃣ NumPy – The math engine under the hood. If Pandas is the fancy restaurant, NumPy is the kitchen where the slicing & dicing happens fast.
3️⃣ Matplotlib – The blank canvas. Basic lines, bars, histograms—ugly by default, but it never says “no” to a custom plot.
4️⃣ Seaborn – The interior decorator. Built on Matplotlib, but adds instant style: heatmaps, violin plots, correlation matrices in 1–2 lines.
5️⃣ Scikit-Learn – The machine brain. Load your cleaned data, split train/test, and call .fit() to spin up models from logistic regression to random forests.
How to use this roadmap
Pick ONE messy dataset that excites you (Kaggle, your Fitbit logs, company sales export—whatever).
Day 1: clean & explore with Pandas + NumPy.
Day 2: visualize trends using Matplotlib/Seaborn.
Bonus Day 3: build a quick model in Scikit-Learn and write 3 bullet recommendations.
Wrap everything in a 4-slide deck → instant portfolio project.
⚡️ Pro tip: 80 % of hiring managers just want proof you can ask the right question, wrangle the data, and tell a clear story. These five tools let you do exactly that—nothing more, nothing less.
💾 Save this roadmap, 📤 share it with a friend drowning in tutorial tabs, and follow for more no-BS data-career guides every week.
#datascience #dataanalytics #dataanalyst
Breathe. You don’t need 99 % of it to land your first analyst gig.
This carousel breaks down the only five libraries I teach my boot-camp students when the goal is “get hired ASAP.”
1️⃣ Pandas – Excel on steroids. Read a CSV, clean up the mess, join tables, spit out insights.
2️⃣ NumPy – The math engine under the hood. If Pandas is the fancy restaurant, NumPy is the kitchen where the slicing & dicing happens fast.
3️⃣ Matplotlib – The blank canvas. Basic lines, bars, histograms—ugly by default, but it never says “no” to a custom plot.
4️⃣ Seaborn – The interior decorator. Built on Matplotlib, but adds instant style: heatmaps, violin plots, correlation matrices in 1–2 lines.
5️⃣ Scikit-Learn – The machine brain. Load your cleaned data, split train/test, and call .fit() to spin up models from logistic regression to random forests.
How to use this roadmap
Pick ONE messy dataset that excites you (Kaggle, your Fitbit logs, company sales export—whatever).
Day 1: clean & explore with Pandas + NumPy.
Day 2: visualize trends using Matplotlib/Seaborn.
Bonus Day 3: build a quick model in Scikit-Learn and write 3 bullet recommendations.
Wrap everything in a 4-slide deck → instant portfolio project.
⚡️ Pro tip: 80 % of hiring managers just want proof you can ask the right question, wrangle the data, and tell a clear story. These five tools let you do exactly that—nothing more, nothing less.
💾 Save this roadmap, 📤 share it with a friend drowning in tutorial tabs, and follow for more no-BS data-career guides every week.
#datascience #dataanalytics #dataanalyst
 1:00:06
 0:07:08
 0:10:30
 4:26:52
 0:00:55
 0:17:42
 6:14:07
 0:00:35
 2:07:34
 0:00:17
 0:00:13
 0:02:24
 0:00:57
 1:03:21
 5:31:30
 4:40:00
 0:00:32
 0:20:51
 0:24:50
 0:00:24
 0:00:54
 0:00:06
 1:19:41
 0:06:46