filmov
tv
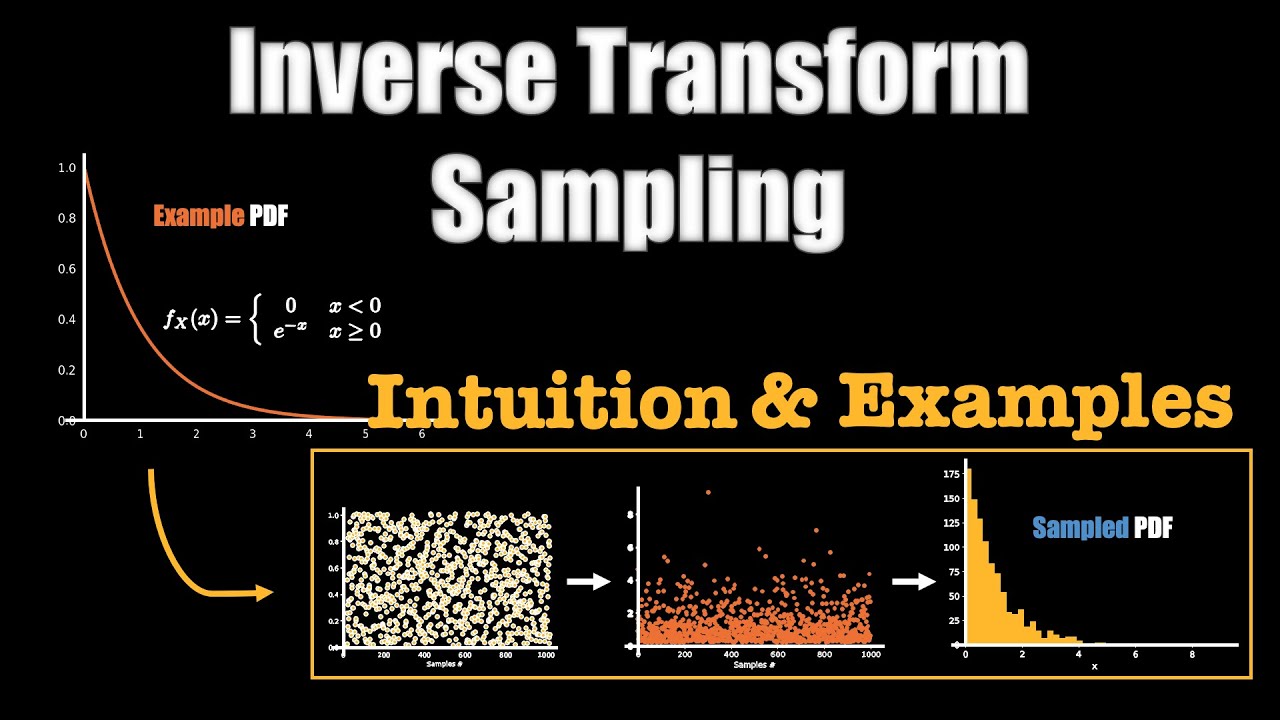
Inverse Transform Sampling - VISUALLY EXPLAINED with EXAMPLES!
Показать описание
This tutorial explains the Inverse Transform Sampling using a simple example. The proof of why the algorithm/transform works is also explained.
#sampling
#statistics
#distributions
#sampling
#statistics
#distributions
 0:13:29
Inverse Transform Sampling - VISUALLY EXPLAINED with EXAMPLES!
 0:10:54
Inverse Transform Sampling : Data Science Concepts
 0:02:17
Inverse Transform Sampling | How a computer can choose random numbers from a given distribution.
 0:10:26
Every Random Variable is a Transformation of U[0,1] (Inverse Transform Sampling)
 0:07:56
Inverse Transform Sampling | Triangular Distribution
 0:00:40
PDF Sampling: Inverse transform sampling (case: Plummer model)
 0:06:43
Inverse Probability Transform & Proof (Sampling technique)
 0:25:37
Making an animated gif for Wikipedia using Python (tutorial) - Inverse Transform Sampling
 0:18:56
Simulating Continuous Distributions via Inverse Transform Sampling
 0:03:32
Google Data Science interview Question | Inverse Transform Sampling | Truncated Normal | Python
 0:00:27
Sine Curve and the Unit Circle
 0:19:23
Lect 1 : Inverse transformation method using Rstudio
 0:09:08
Simulating the Pareto Distribution with Inverse Transform Sampling
 0:01:39
Random numbers: Rejection Method 01: The Idea
 0:47:51
What is Monte Carlo simulation in statistics? Inverse transform m |Class 14,CS1-Actuarial Statistics
 0:17:49
Accept-Reject Sampling : Data Science Concepts
 0:46:39
Generating the Random Numbers Using the Inverse Transform Method
 0:31:37
Monte Carlo Methods - VISUALLY EXPLAINED!
 0:11:40
Using The Inverse CDF Method to Simulate Random Variables
 0:08:12
AST9240 - Inversion Sampling
 0:15:27
Rejection Sampling - VISUALLY EXPLAINED with EXAMPLES!
 0:10:05
inverse transform technique
 0:03:35
Code Review: Inverse transform sampling (2 Solutions!!)
 0:06:38
Inverse CDF method
Комментарии