filmov
tv
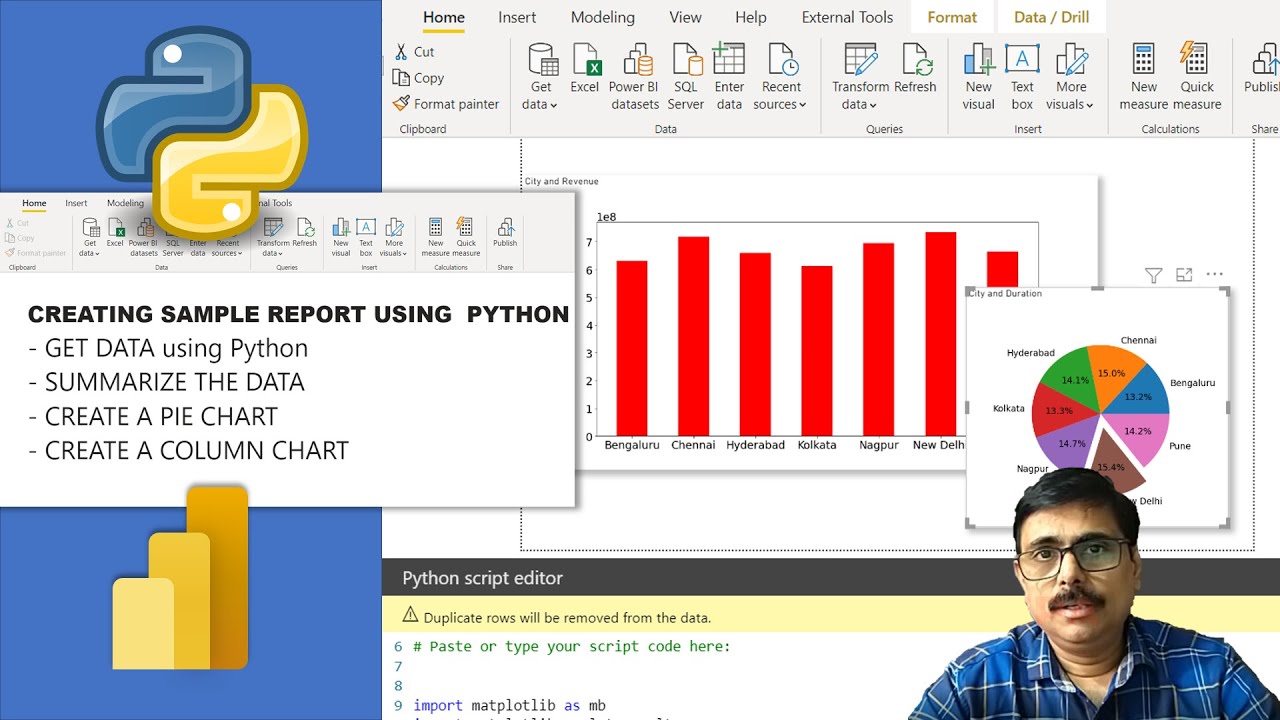
Get Data , ETL and Report Creation using Python in Power BI
Показать описание
This video will help you to understand the value brought by the integration of the Python into Power BI Desktop and how it provides a powerful tool for transforming and presenting business intelligence data. Also you can learn how to use different charts types available in Python while using it in Power BI
Este video lo ayudará a comprender el valor que aporta la integración de Python en Power BI Desktop y cómo proporciona una herramienta poderosa para transformar y presentar datos de inteligencia empresarial. También puede aprender a usar diferentes tipos de gráficos disponibles en Python mientras lo usa en Power BI
このビデオは、PythonをPower BI Desktopに統合することによってもたらされる価値と、Pythonがビジネスインテリジェンスデータを変換および表示するための強力なツールをどのように提供するかを理解するのに役立ちます。 また、Power BIで使用しながら、Pythonで使用可能なさまざまなグラフの種類を使用する方法を学ぶことができます
Это видео поможет вам понять, какую ценность приносит интеграция Python в Power BI Desktop, и как он предоставляет мощный инструмент для преобразования и представления данных бизнес-аналитики. Также вы можете узнать, как использовать различные типы диаграмм, доступные в Python, при использовании его в Power BI.
Tutulungan ka ng video na ito na maunawaan ang halagang dala ng pagsasama ng Python sa Power BI Desktop at kung paano ito nagbibigay ng isang napakalakas na tool para sa pagbabago at pagpapakita ng data ng intelligence ng negosyo. Maaari mo ring malaman kung paano gumamit ng iba't ibang mga uri ng tsart na magagamit sa Python habang ginagamit ito sa Power BI
ဒီဗီဒီယိုက Python ကို Power BI Desktop နဲ့ပေါင်းစပ်လိုက်ခြင်း၏တန်ဖိုးနှင့်စီးပွားရေးထောက်လှမ်းရေးအချက်အလက်များကိုအသွင်ပြောင်းခြင်းနှင့်တင်ပြခြင်းအတွက်အားကောင်းတဲ့ကိရိယာတစ်ခုဘယ်လိုပေးသလဲဆိုတာကိုနားလည်ဖို့ကူညီလိမ့်မယ်။ Power BI တွင်အသုံးပြုနေစဉ် Python ရှိဇယားပုံစံအမျိုးမျိုးကိုမည်သို့အသုံးပြုရမည်ကိုလေ့လာနိုင်သည်
Este vídeo ajudará você a entender o valor trazido pela integração do Python no Power BI Desktop e como ele fornece uma ferramenta poderosa para transformar e apresentar dados de business intelligence. Além disso, você pode aprender a usar diferentes tipos de gráficos disponíveis em Python enquanto o usa no Power BI
 0:00:44
Use Python to create a simple ETL data pipeline to extract, transform and load weather data from a R
 0:07:25
ETL (Extract, Transform, Load) | Data 📊Aggregation | Data Warehouse🏭 & Mining ⛏️
 0:00:57
ETL in 60 seconds | Extract Transform Load ETL explained
 0:04:52
What is ETL (Extract, Transform, Load)?
 0:13:56
What is ETL with a clear example - Data Engineering Concepts
 0:04:42
ETL vs ELT | Modern Data Architectures
 0:08:07
What is ETL | What is Data Warehouse | OLTP vs OLAP
 0:04:26
Get data into warehouses using ETL - What is ETL | What is data warehouse | OLTP vs OLAP
 0:23:50
Complete SQL in Telugu - Data Types I #sql #dataanalysis #telugu
 0:10:05
Get Data Into Databricks - Simple ETL Pipeline
 0:06:58
ETL Made Simple | What Data Analysts Should Know
 0:10:29
Get Data , ETL and Report Creation using Python in Power BI
 0:00:57
ETL Simplified for Beginners in 60 Seconds | Data Warehouse | Extract, Transform, Load Tools #shorts
 0:00:41
The Difference Between ETL & ELT (Part 1) #shorts
 0:00:34
Is Data Engineering the New Best Job?
 0:01:09
ETL (Extract Transform Load) für Data Warehousing einfach erklärt
 0:05:22
Database vs Data Warehouse vs Data Lake | What is the Difference?
 0:07:46
What is ETL for Beginners | ETL Non-Technical Explanation
 0:00:37
Data Lakes Simplified in under 60 Seconds
 0:00:57
Data Engineer Roadmap | Must Know Skills🔥| Data Engineering Skills
 0:32:18
Get Rid of Traditional ETL, Move to Spark! (Bas Geerdink)
 0:01:00
ETL Process explained #shorts #etltesting #database #dataanalytics
 0:00:58
ETL vs ELT - what's the difference? #masteringsnowflake #dbt
 0:00:41
ETL vs. Reverse ETL (What's the Difference?)
Комментарии