filmov
tv
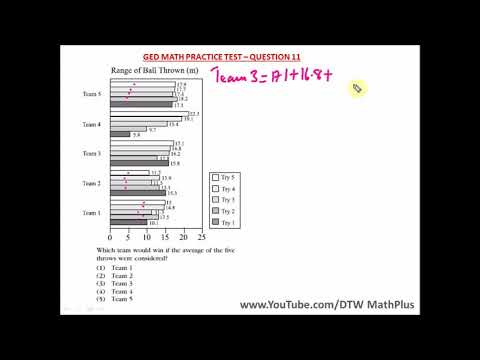
G.E.D. Math 17b, Bar & Line graphs

Показать описание
An explanation of bar graphs, line graphs, and their different types. How the scale increments may be listed, the labels, and the key. Using bar and line graphs to solve word problems.
Grade 5 Math #9.1, Finding Averages and Using Line Plots
Grade 5 Math 9.2, Ordered Pairs, Coordinate Grid, X and Y Axis
Grade 5 Math #9.3, How to Graph Data on a Grid
Grade 5 Math #9.4, Line Graphs, Scales and Intervals
Grade 6 Math #7.1, Double Bar graphs and Double line graphs
Grade 6 Math #7.2, Circle graphs - Pie charts
Grade 6 Math #7.4, How to make and use Line plots, frequency tables, relative frequency tables
Grade 6 Math #7.5a, How to make Stem-and-leaf Plots
Grade 6 Math #7.5b, How to make and use a Histogram
Grade 6 Math #7.6, Problem Solving - Choosing the right Graph
G.E.D. Math 17a, Tables & charts
SUPPORT MY WORK:
YOUTUBE FAN FUNDING on my channel Home page
If you can't afford to become a monthly patron...
click or watch the ads to help me out.
FOLLOW ME:
.
 0:07:54
 0:09:25
 0:06:30
 0:10:02
 0:37:11
 0:07:55
 0:05:03
 0:16:27
 0:03:09
 0:30:54
 0:03:44
 1:00:07
 0:30:19
 0:06:21
 0:20:08
 0:12:44
 1:29:13
 0:37:44
 0:05:04
 1:19:31
 0:05:45
 0:05:01
 0:00:39
 0:15:47