filmov
tv
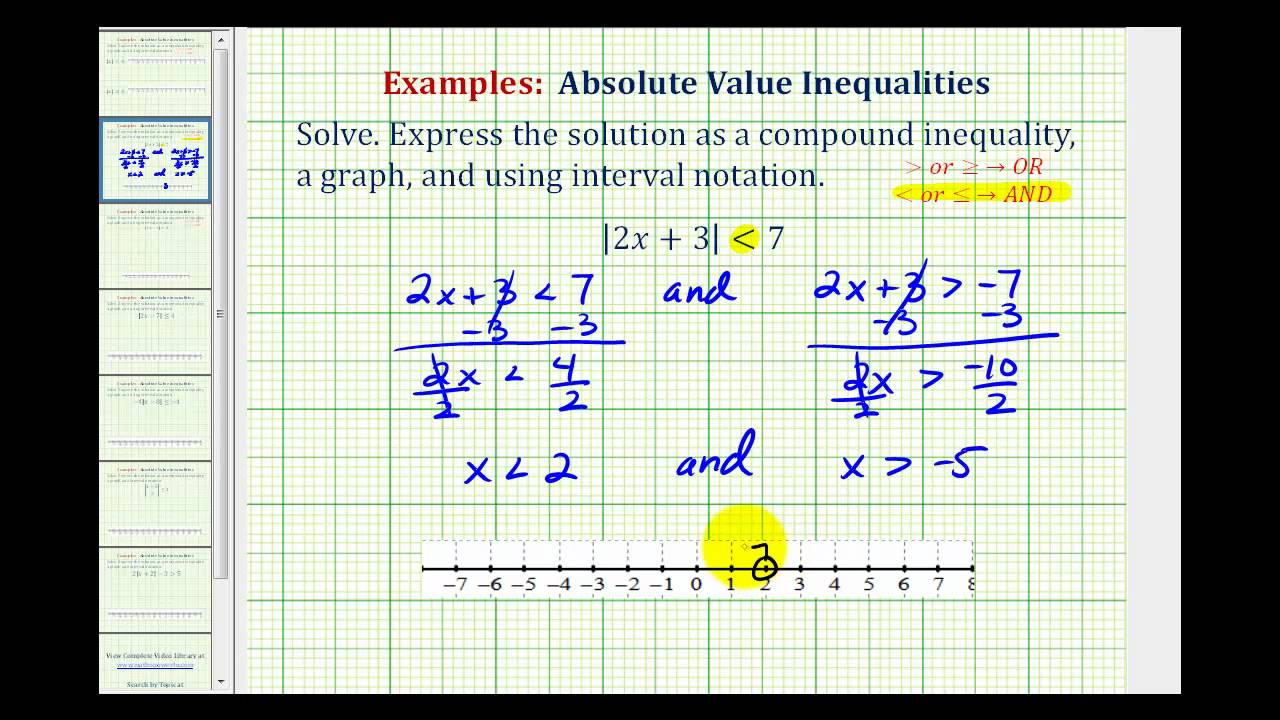
Ex 2: Solve and Graph Absolute Value inequalities
Показать описание
This video explains how to solve two absolute value inequalities. The solution is expressed as a compound inequality, a graph, and using interval notation.
 0:05:38
Ex 2: Solve and Graph Absolute Value inequalities
 0:04:50
Ex 2: Graph a Linear Equation Containing Fractions Using a Table of Values
 0:04:54
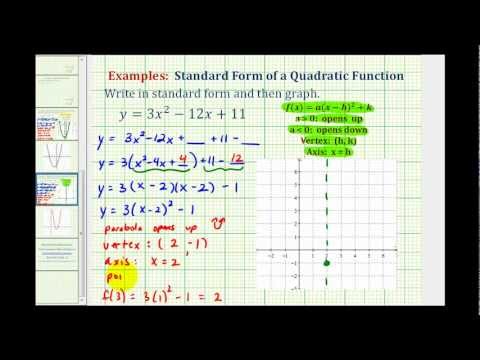
Ex 2: Graph a Quadratic Function in Standard Form
 0:06:04
Ex2: Write a Quadratic Function in Standard Form to Graph (a not 1)
 0:04:17
Ex 2: Graph a System of Linear Inequalities
 0:08:36
Ex2: Graph a Quadratic Function in General Form
 0:01:52
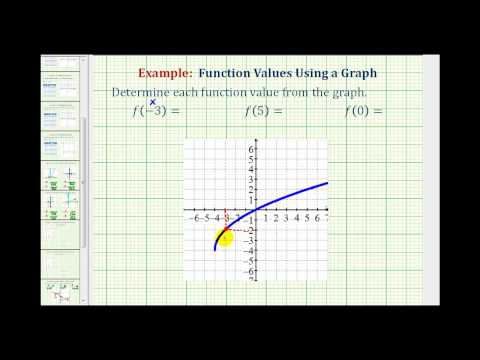
Ex 2: Determine a Function Value From a Graph
 0:07:37
Ex 2: Determine the Function From the Graph of a Piecewise Defined Function
 0:30:48
Ch-4 Linear equation in two variable | One Shot Video | Class 9th Mathematics @edugrown9-10
 0:03:41
Ex 2: Graph a Quadratic Inequality on the Coordinate Plane
 0:04:03
Ex 2: Graph a Piecewise Defined Function
 0:04:56
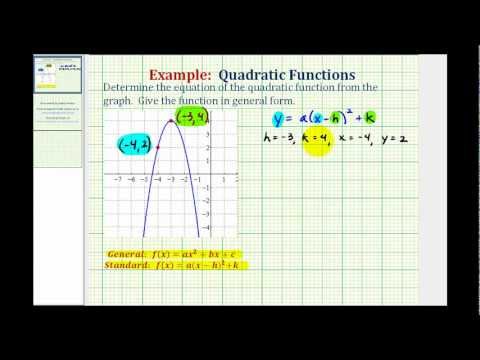
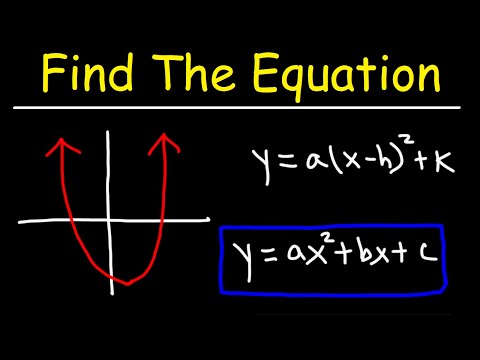
Ex: Find the Equation of a Quadratic Function from a Graph
 0:02:47
Ex 2: Graph a Linear Equation in Slope-Intercept Form
 0:03:33
Ex 2: Graph a Linear Equation in Standard Form Using the Intercepts
 0:09:35
How To Find The Equation of a Quadratic Function From a Graph
 0:05:18
Ex 2: Interpret the Graph of the First Derivative Function - Degree 3
 0:03:56
Getting two trendlines on one Excel graph
 0:04:55
How to graph a linear equation using MS excel
 0:02:19
Ex: Identify the Solution to a System of Equation Given a Graph, Then Verify
 0:02:48
GCSE Maths - What are Quadratic Graphs? #76
 0:08:57
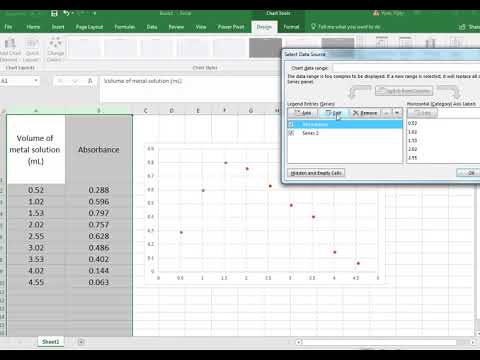
How to graph a Quadratic equation using MS Excel
 0:04:24
Ex: Find the Equation of a Transformed Exponential Function From a Graph
 0:02:23
How to Graph y = x + 2
 0:30:15
Class 9, Maths(CH), Ex. 9.2(5,11,14,15) - graph
Комментарии