filmov
tv
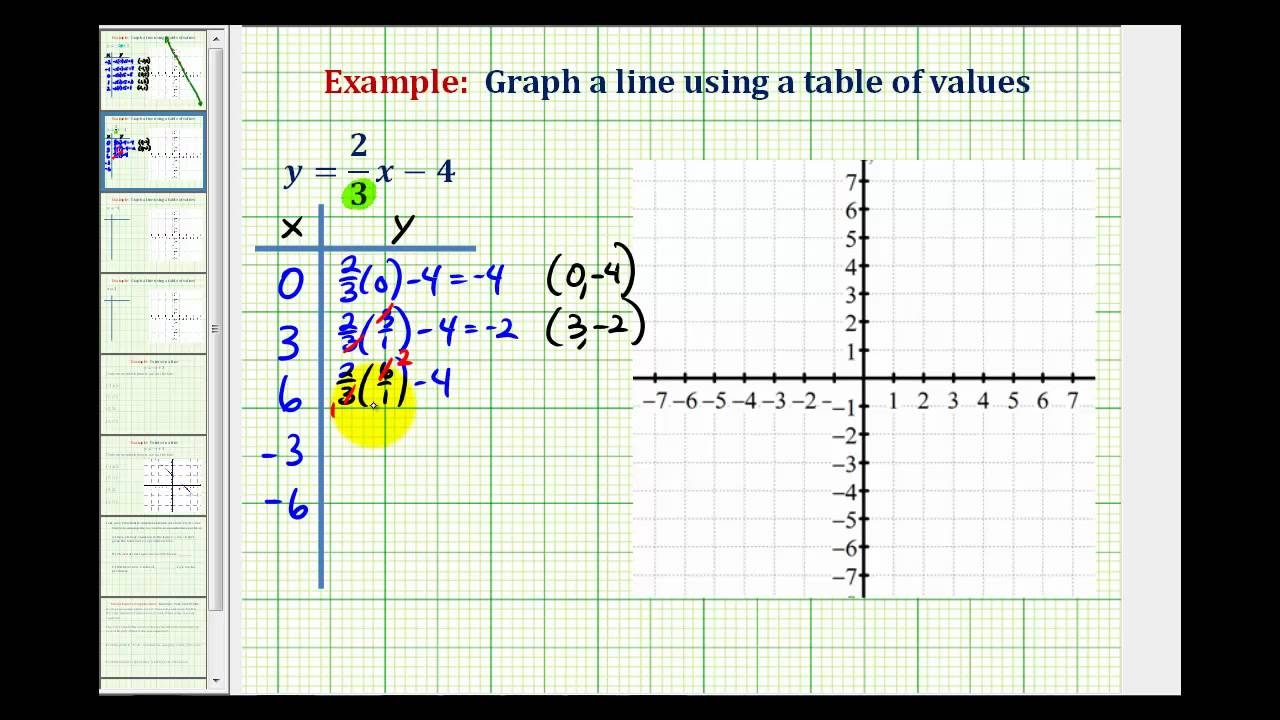
Ex 2: Graph a Linear Equation Containing Fractions Using a Table of Values
Показать описание
This video provides an example of graphing a line solved for y containing fractions using a table of values.
 0:04:50
Ex 2: Graph a Linear Equation Containing Fractions Using a Table of Values
 0:02:47
Ex 2: Graph a Linear Equation in Slope-Intercept Form
 0:04:17
Ex 2: Graph a System of Linear Inequalities
 0:03:33
Ex 2: Graph a Linear Equation in Standard Form Using the Intercepts
 0:04:24
Ex 2: Graph a Line in Slope Intercept Form - Change of Form of Slope Required (negative)
 0:02:40
Ex 2: Graph a Linear Equation in Standard From by Writing in Slope-Intercept Form
 0:01:56
Ex 2: Graph a Direct Variation Equation (negative slope)
 0:04:29
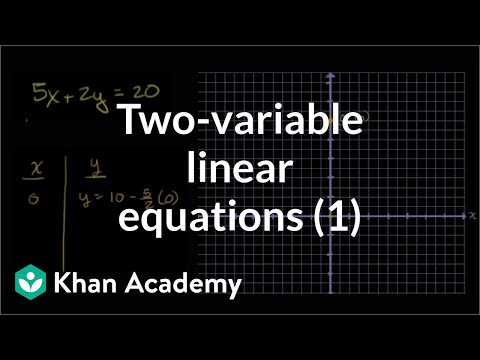
Graphing solutions to two-variable linear equations example 1 | Algebra I | Khan Academy
 1:07:46
Ultimate GED Math Algebra Study Guide Part 2 to Score Higher
 0:07:10
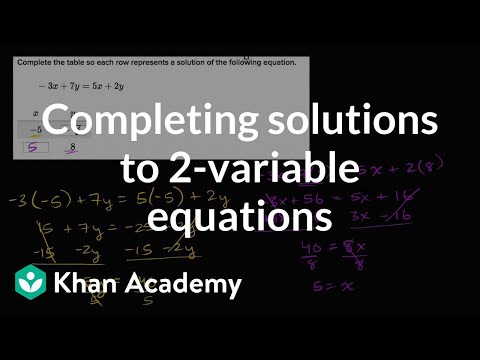
Graphing solutions to two-variable linear equations example 2 | Algebra I | Khan Academy
 0:01:39
Graph a Linear Function f(x) = 3x - 2
 0:05:27
Ex 2: Graph a Transformation of an Absolute Value Function Using a Table
 0:03:27
Ex: Graph a Linear Function Using a Table of Values
 0:02:28
Ex 2: Determine the Slope Given the Graph of a Line (negative slope)
 0:13:10
Graphs of linear equations | Linear equations and functions | 8th grade | Khan Academy
 0:03:55
Graph a Line by Plotting Points - Example 2
 0:04:03
Ex 2: Graph a Piecewise Defined Function
 0:05:15
Solving Systems of Equations By Graphing
 0:02:18
Graph an equation with a negative fractional slope
 0:03:33
Ex 1: Graph a Linear Equation Using a Table of Values
 0:32:05
Linear Equations - Algebra
 0:03:46
How to Graph Lines in Slope Intercept Form (y=mx+b)
 0:02:30
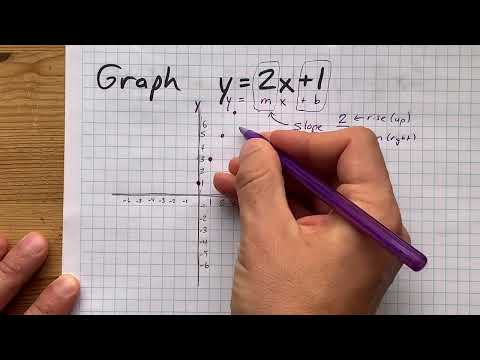
Graph the line y=2x+1
 0:00:33
Graph each linear equation. See Examples 2 through 6. x+y=1
Комментарии