filmov
tv
Probability: Binomial Distribution

Показать описание
In essence, Binomial events are a sequence of identical Bernoulli events. Before we get into the difference and similarities between these two distributions, let us examine the proper notation for a Binomial Distribution. We use the letter “B” to express a Binomial distribution, followed by the number of trials and the probability of success in each one. Therefore, we read the following statement as “Variable “X” follows a Binomial distribution with 10 trials and a likelihood
of success of 0.6 on each individual trial”. Additionally, we can express a Bernoulli distribution
as a Binomial distribution with a single trial. Alright! To better understand the differences between
the two types of events, suppose the following scenario. You go to class and your professor gives the class a surprise pop-quiz, which you have not prepared for. Luckily for you, the quiz consists of 10 true or false problems. In this case, guessing a single true or false question is a Bernoulli event, but guessing the entire quiz is a Binomial Event.
365 Data Science is an online educational career website that offers the incredible opportunity to find your way into the data science world no matter your previous knowledge and experience. We have prepared numerous courses that suit the needs of aspiring BI analysts, Data analysts and Data scientists.
We at 365 Data Science are committed educators who believe that curiosity should not be hindered by inability to access good learning resources. This is why we focus all our efforts on creating high-quality educational content which anyone can access online.
#probability #binomial #distribution
 0:20:27
Finding The Probability of a Binomial Distribution Plus Mean & Standard Deviation
 0:12:34
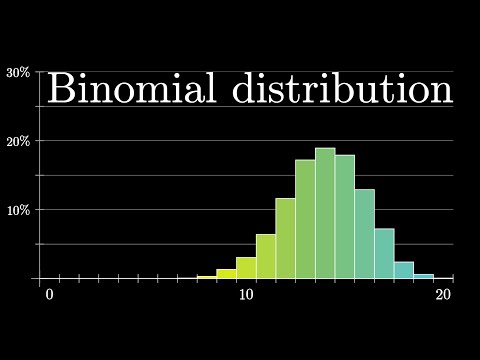
Binomial distributions | Probabilities of probabilities, part 1
 0:11:51
Binomial distribution | Probability and Statistics | Khan Academy
 0:06:51
Probability: Binomial Distribution
 0:09:08
Binomial Distribution EXPLAINED with Examples
 0:15:47
The Binomial Distribution and Test, Clearly Explained!!!
 0:13:30
Binomial Distribution EXPLAINED in UNDER 15 MINUTES!
 0:15:18
A Secret Weapon for Predicting Outcomes: The Binomial Distribution
 0:34:58
2nd PUC statistics | Theoretical distribution | Binomial distribution | PUC Exam 2024-25 #2ndpucexam
 0:14:11
An Introduction to the Binomial Distribution
 0:11:32
Basics of Probability, Binomial and Poisson Distribution
 0:19:34
Binomial Probability Distribution
 0:14:15
The Binomial Distribution: Crash Course Statistics #15
 0:07:07
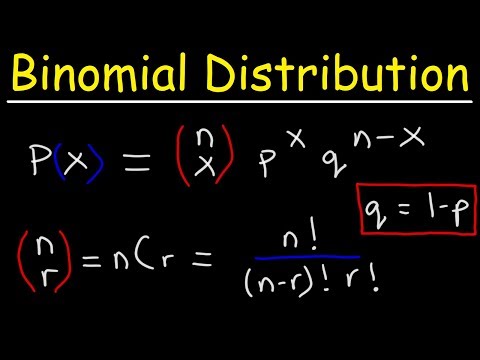
Binomial Probability Distribution Formula
 0:13:26
Binomial Probability (1 of 2: Preliminary Example w/ Probability Tree)
 0:27:12
Statistics - Binomial & Poisson Distributions
 0:03:50
Binomial Probability
 0:25:40
Calicut University /Bcom BBA /QT Binomial Distribution Full part
 0:40:51
Binomial Distribution|Probability Distribution|Statistics|BBA|BCA|BCOM|Dream Maths
 0:10:58
Statistics | Binomial Distribution | Probability | BCOM, BBA & MBA
 0:24:33
Binomial Distribution Probability
 0:16:12
Introduction to Poisson Distribution - Probability & Statistics
 0:07:32
Binomial distribution probability (solve with easy steps)
 0:06:07
Binomial Distribution In Probability | Binomial Distribution Explained | Statistics | Simplilearn
Комментарии