filmov
tv
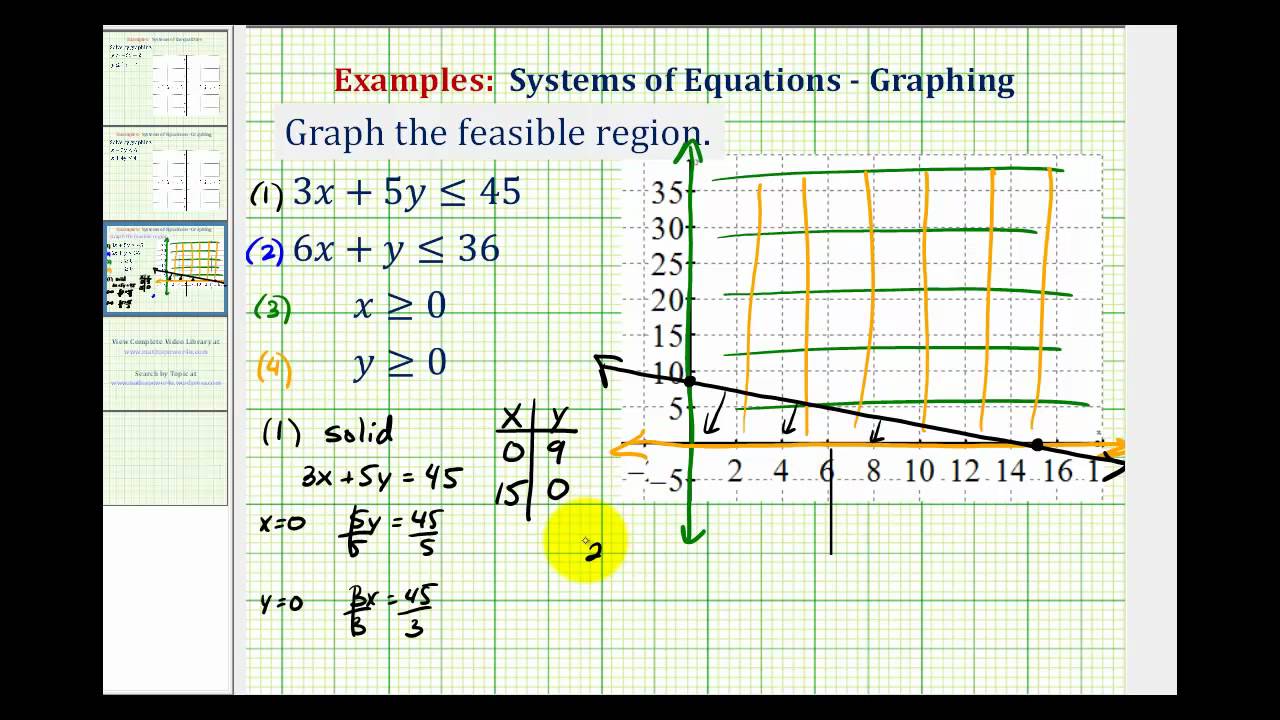
Ex 3: Graph the Feasible Region of a System of Linear Inequalities
Показать описание
This video provides an example of how to graph the feasible region to a system of linear inequalities. The system contains 4 inequalities.
 0:05:24
Ex 3: Graph the Feasible Region of a System of Linear Inequalities
 0:05:36
Graph the system of three linear inequalities and determine the feasible region ex 15
 0:05:43
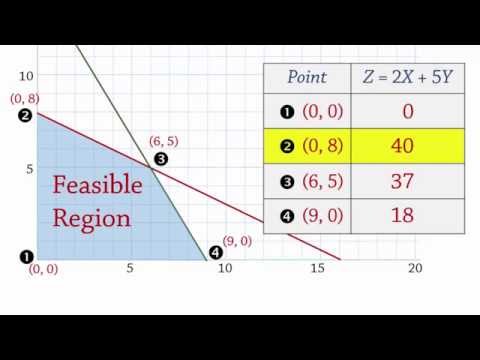
Linear Programming 1: Maximization -Extreme/Corner Points (LP)
 0:06:26
Learn how to determine the feasible region of three linear inequalities ex 16
 0:15:08
Linear Programming (Optimization) 2 Examples Minimize & Maximize
 0:05:27
LP Graphical Method (Multiple/Alternative Optimal Solutions)
 0:03:52
Learn how to determine the feasible region of a system of inequalities
 0:07:20
Inequalities: Region on Graph
 0:08:30
How to Solve an LP Problem Graphically in Excel
 0:07:06
Feasible Region on Desmos
 0:04:23
Graphing a system of two inequalities to determine the feasible region
 0:19:13
Use Excel to easily graph a constraint and find the feasible region
 0:01:08
Linear Programming 3D Example - Feasible Region
 0:33:20
Linear Programming
 0:04:19
MAT106: Chapter 2 (Linear Programming) - Graphing the Feasible Region Polygon
 0:03:41
Ex: Find the Max and Min of an Objective Function Given the Feasible Region Using Linear Programming
 0:05:52
Linear Programming 3: Graphical Solution – with negative coefficients
 0:05:09
Graph a feasible region example 2
 0:07:18
Graphing a system of three linear inequalities using slope intercept form ex 18
 0:04:03
Find the feasible region and corners...WebAssign assignment (section 3.2)
 0:03:29
EcoVid Linear Programming: Graphing the Feasible Region
 0:05:21
Graph a feasible region given a set of constraints
 0:07:58
Solving Linear Programming Problem using Excel's Solver
 0:18:04
mat 218 s 3 1 graphing feasible regions part 1
Комментарии