filmov
tv
Global Rainfall

Показать описание
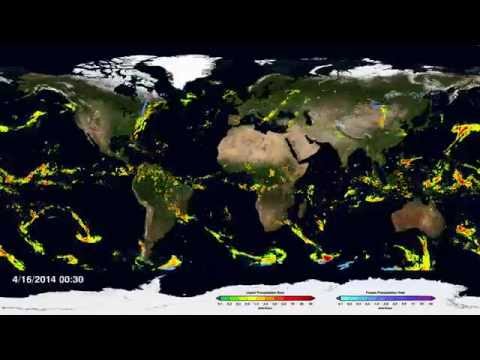
This visualisation shows a selection of severe weather events associated with extreme rainfall (precipitation) during July, August, September and October 2004, using information provided by the DAPACLIP project.
The DAPACLIP (Global DAily Precipitation Analysis for the validation of medium-range CLImate Predictions) project uses daily data from satellites as well as weather station data to create a combined daily global precipitation dataset.
The Global Precipitation Climatology Centre (GPCC) aggregates weather station data from different sources into a common database. A global gridding procedure is then applied to produce quality-controlled daily precipitation values.
Over the ocean, satellite data provided by the EUMETSAT SAF for Climate Monitoring (CM SAF) is used to derive the precipitation fields. The retrieval was based on the "Hamburg Ocean Atmosphere Parameters and Fluxes from Satellite Data" set (HOAPS) - and used passive microwave data from the SSM/I (Special Sensor Microwave Imager) on board polar-orbiting satellites.
The product shown here is an experimental dataset that is produced within the MiKlip (Mittelfristige Klimaprognosen / Decadal climate predictions) project and will be used to evaluate decadal climate predictions. The period from 1988 to 2008 is currently covered by the dataset. A planned extension will use additional satellite data for improved spatio-temporal coverage over the ocean.
The audio commentary is by Mark Higgins, a trainer and educator at EUMETSAT.
For further information:
 0:04:40
Global Rainfall
 0:01:54
NASA | First Global Rainfall and Snowfall Map from New Mission
 0:00:41
NASA Study Projects Warming-Driven Changes in Global Rainfall
 0:02:54
Global Rainfall and Snowfall Map
 0:00:12
Global rainfall since 250 million years ago
 0:06:20
Europe’s climate in 2050
 0:16:24
See what three degrees of global warming looks like
 0:03:04
NASA’s Global Tour of Precipitation in Ultra HD (4K)
 0:01:48
How does rain form and what is the water cycle?
 0:00:55
Annual Global Rainfall Time-lapse
 0:01:19
How to use 'JAXA Climate Rainfall Watch' (In one minute)
 0:00:48
global rainfall
 0:08:58
Download climate data [Rainfall, temperature, humidity] from 1981 2021
 0:08:32
Why does global warming cause increased extreme rainfall events?
 0:01:43
Water Gushes Through Sand Of Sahara | WION Climate Tracker | World News
 0:10:15
Download Rainfall Data (Hourly, Daily, Monthly, Yearly), Data Processing & Map Preparation in Ar...
 0:00:11
'Worlds in Drops: Mapping the Marvels of Global Rainfall Distribution'
 0:16:57
The Asian Monsoon - The World's Largest Weather System
 0:03:41
NASA Rainfall Data and Global Fire Weather
 0:01:06
Extreme rainfall events are connected across the world
 0:01:03
Research shows global warming causes heavy rainfall in Japan
 0:01:44
Tamil Nadu Braces For Heavy Rainfall: Emergency Measures Put In Place | WION Climate Tracker
 0:04:11
Global Rainfall Erosivity Data form ESDAC
 0:00:38
Japan launches hi-tech global rainfall satellite
Комментарии