filmov
tv
Two-Sample t Test in R (Independent Groups) with Example | R Tutorial 4.2 | MarinStatsLectures
Показать описание
Independent two sample t-test and confidence interval are parametric methods appropriate for examining the difference in means for two populations. These are ways of examining the relationship between a numeric outcome variable (Y variable) and a categorical explanatory variable (X variable with 2 levels)
Table of Content:
0:00:10 when should we use the independent two sample t-test and confidence interval in statistics and in research
0:00:53 how to access the help menu in R for t-test
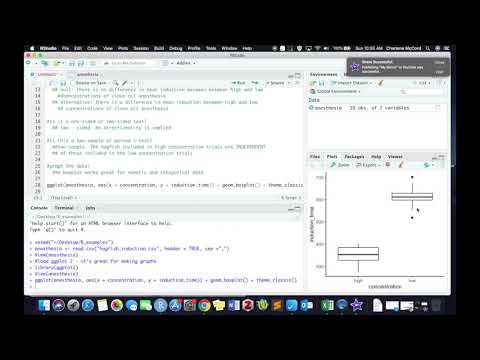
0:01:04 how to visually examine the relationship between two variables in R
0:01:56 introducing the null and alternative hypothesis, the confidence interval, and variance assumption with example
0:03:06 how to use the "mu" argument in two-sided t-test
0:03:12 how to use the "alt" argument to do a one-sided t-test
0:03:18 how to use the "conf" argument to change the confidence level for the t-test
0:03:29 how to let R know that groups are paired or dependent using the "paired" argument
0:04:18 how to decide if we should assume equal or non-equal variances using boxplot
0:04:38 how to decide if we should assume equal or non equal variances comparing the actual variances
0:05:02 how to test the null hypothesis "that the population variances are equal" using Levene's test using "leveneTest" function
► ► Watch More:
Follow MarinStatsLectures
Our Team:
Content Creator: Mike Marin (B.Sc., MSc.) Senior Instructor at UBC.
Producer and Creative Manager: Ladan Hamadani (B.Sc., BA., MPH)
These videos are created by #marinstatslectures to support some Statistics and R Programming courses at the University of British Columbia (UBC) (#IntroductoryStatistics and #RVideoTutorials ), although we make all videos available to the everyone everywhere for free.
Thanks for watching! Have fun and remember that statistics is almost as beautiful as a unicorn!
#statistics #r_programming
 0:03:21
Two sample t test in R Studio
 0:06:31
Two-Sample t Test in R (Independent Groups) with Example | R Tutorial 4.2 | MarinStatsLectures
 0:02:37
Two sample t-Test in R - calculation and interpretation
 0:11:49
two sample t-test in R Studio
 0:12:07
Two Sample t-Tests in R
 0:03:19
Two Sample T Test in R | Independent T Test for Two Samples in R
 0:04:02
Doing a t-test using R programming (in 4 minutes)
 0:03:20
R Tutorial for Two Sample t test and Confidence Interval
 0:12:54
Independent t test using r studio(rstudio)(independent two samplet test)
 0:16:14
t-Test - Full Course - Everything you need to know
 0:06:56
Two-sample t test for difference of means | AP Statistics | Khan Academy
 0:06:10
Robust t Test in R (two-sample t-test, Yuen's test)
 0:07:59
R demo | Two-Samples t-Test | Student’s & Welch’s | How to conduct, visualise, interpret & m...
 0:11:06
Paired t-test in R
 0:04:36
Two sample t- and z-tests for matched data in R
 0:10:11
Student's t-test
 0:07:21
How To... Select the Correct t-test to Compare Two Sample Means
 0:05:30
Two sample t- and z-tests for unmatched data in R
 0:07:46
How To... Perform an Independent Samples (Unequal Variance) t Test in R #87
 0:09:02
How To... Perform an Independent Samples (Equal Variance) t Test in R #86
 0:15:22
Two Sample t-test for Independent Groups | Statistics Tutorial #23| MarinStatsLectures
 0:14:34
Two Sample t-Test:Equal vs Unequal Variance Assumption| Statistics Tutorial #24| MarinStatsLectures
 0:06:19
R demo | Paired Samples t-Test | How to conduct, visualise and interpret
 0:08:31
The Two-Sample Test of Proportions in R
Комментарии