filmov
tv
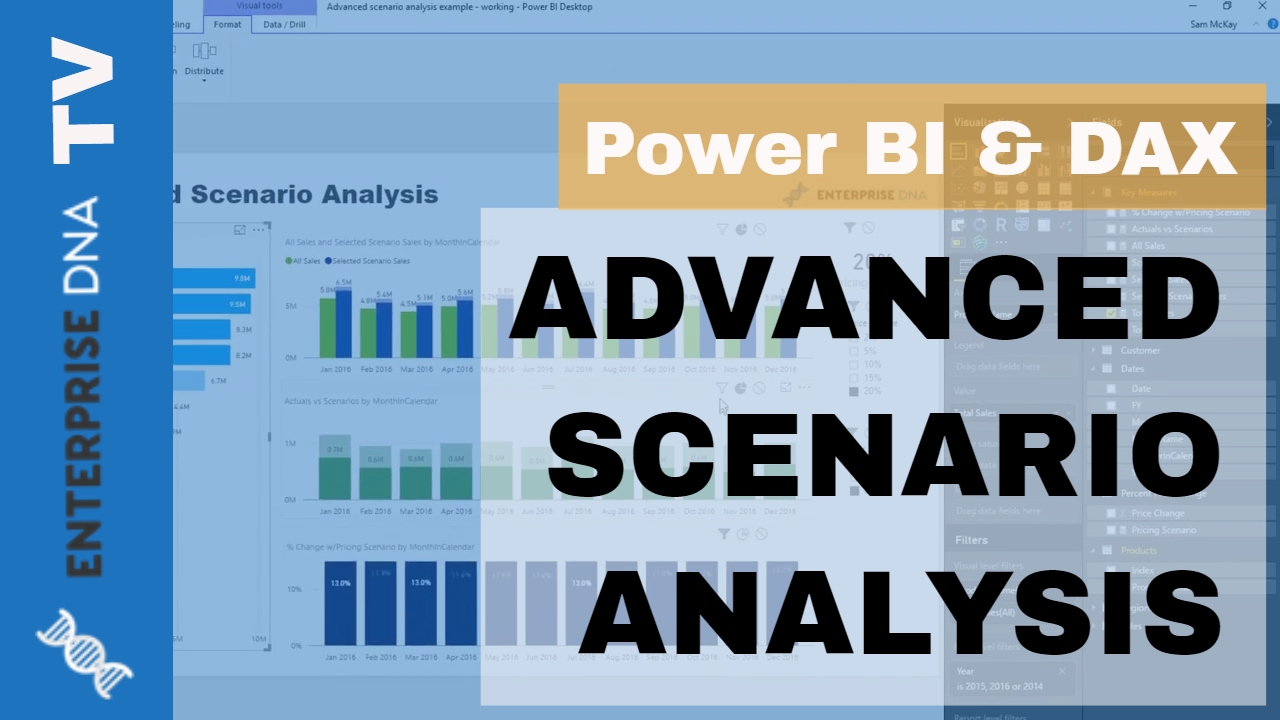
Advanced Scenario Analysis Techniques For Power BI w/DAX
Показать описание
Review how to run simple and advanced scenario analysis techniques in Power BI. In this example we run through how you can dynamic 'shock' pricing and see how that impacts sales
*****Video Details*****
0:16 - Introduction
2:24 - Total Sales Using SUM vs Total Sales Using SUMX
4:20 - Creating A Supporting Table To Show Price Changes
5:42 - Harvesting The Price Change Percentage Selected
6:56 - Calculating Scenario Sales
7:52 - Showing All Sales Impact Of Selected Products
9:32 - Showing Results Of Selected Products
10:45 - Working Out The Master Calculation
12:37 - Branching Out Into More Measures
12:37 - Branching Out Into More Measures For More Insights
14:44 - Creating Compelling Visualizations To Showcase The Results
16:43 - Conclusion
***** Learning Power BI? *****
***** Related Links *****
Using Multi-Layered Scenario Analysis in Power BI
Scenario Analysis Techniques Using Multiple 'What If' Parameters
Advanced Analytics in Power BI: Layering Multiple 'What If' Analysis
***** Related Course Modules *****
Scenario Analysis Series
Solving Analytical Scenarios w/Power & DAX
Advanced Data Transformations & Modeling
***** Related Support Forums *****
Advice On Data Modeling
Data Modelling?
Multiple Conditions Scenario Analysis
For more data model queries to review see here…..
 0:17:55
Advanced Scenario Analysis Techniques For Power BI w/DAX
 0:10:05
Extending Layered Scenario Analysis Techniques - Advanced DAX and Power BI [2022 Update]
 0:09:10
Extending Layered Scenario Analysis Techniques - Advanced DAX & Power BI
 0:10:51
Scenario Analysis in Excel: Financial Modeling
 0:08:51
Advanced Scenario Analysis - Data Visualization with Advanced Excel
 0:08:40
Getting Started With 'What If' Parameters - Scenario Analysis Techniques
 0:02:08
What is “scenario analysis” & why is it the “heart of risk management”? By Brian Barnier...
 0:10:30
'What If' Sensitivity Analysis In Power BI Using DAX - Advanced Technique [2022 Update]
 0:33:02
Scenario analysis.Advanced financial management(AFM)
 0:08:14
Getting Started With 'What If' Parameters - Scenario Analysis Techniques [2022 Update]
 0:07:36
Analyzing Scenario Events In Power BI - Unique Analysis Technique
 0:16:17
How to analyze the risk using Scenario Analysis Techniques
 0:04:47
Scenario Analysis Using XLOOKUP: 4 Minute Quick Lesson
 0:08:42
Excel What-If Analysis Data Table | Easy to Use Once you Learn This☝️
 0:06:07
Scenario Analysis & Modelling
 1:23:08
SCENARIO ANALYSIS
 0:15:22
Build a Dynamic Financial Model in Just 15 Minutes
 0:01:21
Scenario Analysis Predictive Analytics
 0:32:23
Scenario, Sensitivity and Break-even analysis
 0:02:58
Revolutionizing Balance Sheet Management: ALM.NXT's Advanced Scenario Analysis
 0:38:09
Scenario Modelling in Excel Mini-Masterclass (Includes Monte Carlo Simulation)
 0:14:54
Scenario Analysis in Excel! Scenario Analysis DECISION MAKING!
 0:10:02
Layering Multiple 'What If' Scenarios In Power BI - Advanced DAX Concepts [2022 Update]
 0:13:49
Modern Time Series Tools for Scenario Analysis and Portfolio Optimization
Комментарии