filmov
tv
Annual Global Carbon Dioxide Emissions Visualized

Показать описание
Approximately 40 gigatonnes of CO₂ is released into the atmosphere each year. What if you could collect all that gas and stuff it into a box?
This visualized what it what it would look like: a cube that measures 28.3 km (17.6 miles) in each direction that dominates the Boston skyline and the east coast of the US for hundreds of miles and that can be is easily visible from the International Space Station.
Visualization is easily calculated by:
* taking the volume of 1 gram of CO₂ at standard temperate and pressure (about 0.00056659 cubic meters, which is about 1/2 liter)
* multiplying that by 1,000,000 (number of grams in a ton)
* multiplying that times a billion (number of tonnes in a gigatonne)
* multiplying that number by 40
* taking the cube root of that number gives you the length of the cube on each side
 0:01:04
Annual Global Carbon Dioxide Emissions Visualized
 0:03:11
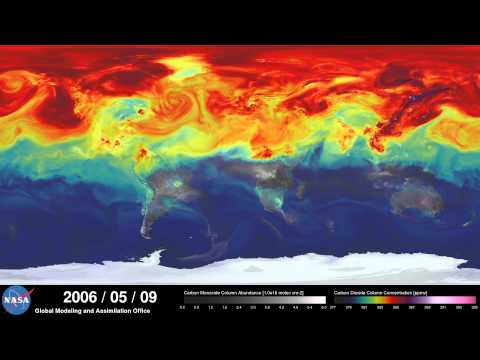
NASA | A Year in the Life of Earth's CO2
 0:02:34
A visual tour of the world's CO2 emissions
 0:04:59
Annual Carbon Dioxide (CO₂) Emissions By Country 1830~2021 | Global Warming
 0:03:06
Largest Countries by Carbon Dioxide (CO2) Emission in the World
 0:03:50
Annual CO₂ (Carbon Dioxide) emissions (1751-2017)
 0:03:21
The Top 13 Countries with the Highest Carbon Dioxide Emissions (1780-2020)
 0:01:03
Annual carbon dioxide (CO₂) emissions worldwide from 1940 to 2023
 0:01:02
Climate in Crisis Carbon Dioxide Emissions Skyrocket
 0:00:31
Measuring Annual Greenhouse Gas Emissions
 0:03:27
TOP 20 Countries by Largest CO2 Emissions from 1965 - 2019 || Carbone dioxide emissions by country
 0:02:22
Top 10 countries regarding annual carbon dioxide emissions
 0:11:39
Why don't we just tax carbon emissions?
 0:00:32
Per-capita emissions
 0:00:31
Countries With The Most Carbon Dioxide Emissions #barchartrace #co2 #emissions #carbondioxide
 0:01:53
Global Carbon Dioxide: 2020-2021
 0:04:19
Carbon Dioxide Emissions by Country (Global Warming) | 1966-2020
 0:00:38
Carbon Dioxide Emissions by Country (Last 55 Years) | Global Warming | 1966-2020 #Shorts
 0:02:54
Top 10: Carbon Dioxide Emissions from Energy: 1997-2021-World in Numbers- Bar Chart Race- Global CO2
 0:01:41
How do countries calculate greenhouse gas emissions?
 0:03:01
Global Energy Review 2021: How has energy demand and CO2 Emissions changed this year
 0:05:16
Top 20 Carbon Dioxide (CO2) Emission Country History (1800-2017)
 0:00:57
Top 10 countries by carbon dioxide emissions in the world
 0:04:02
Top 15 Countries by Carbon Dioxide (CO2) Emissions (1950-2017)
Комментарии