filmov
tv
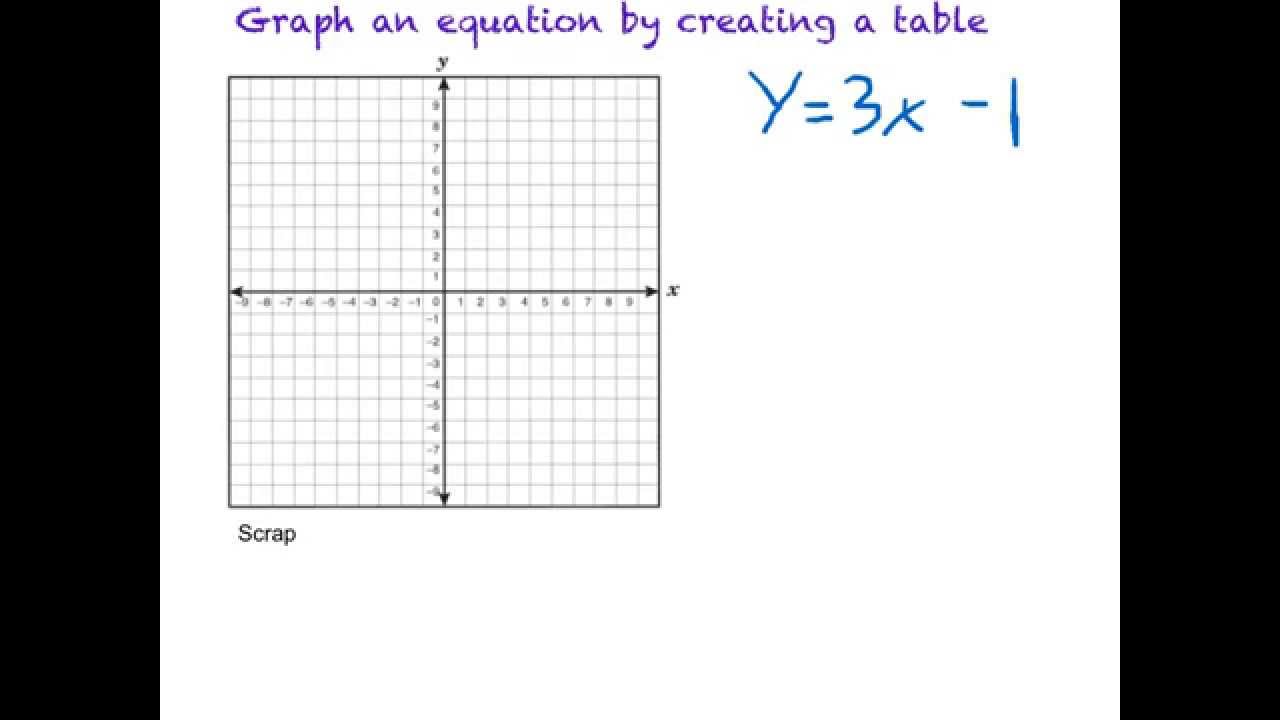
Graph an Equation by Creating a Table
Показать описание
Graph a basic linear equation by finding y values that correspond to a series of x values. Select values for x, then plug them in to find the corresponding value for y. Common values to use are:
x = -2, x = -1, x = 0, x = 1, x = 2.
x = -2, x = -1, x = 0, x = 1, x = 2.
 0:05:06
Graph an Equation by Creating a Table
 0:02:09
Writing the equation from a graph
 0:05:15
Solving Systems of Equations By Graphing
 0:04:53
Graphing a linear equation by rewriting from standard form to slope intercept form
 0:10:14
Algebra Basics: Graphing On The Coordinate Plane - Math Antics
 0:09:35
How To Find The Equation of a Quadratic Function From a Graph
 0:13:10
Graphs of linear equations | Linear equations and functions | 8th grade | Khan Academy
 0:06:04
How to Plot or Graph a Formula/Equation in Microsoft Excel
 0:10:05
How To Find The Equation of a Line From a Graph | Algebra
 0:06:56
Graphing in Algebra: Ordered Pairs and the Coordinate Plane
 0:32:05
Linear Equations - Algebra
 0:03:33
Ex 1: Graph a Linear Equation Using a Table of Values
 0:04:41
Graphing a parabola using roots and vertex | Quadratic equations | Algebra I | Khan Academy
 0:03:15
Graph a linear equation by the x and y intercepts
 0:03:46
How to Graph Lines in Slope Intercept Form (y=mx+b)
 0:02:18
Graph an equation with a negative fractional slope
 0:04:18
How To Plot an Algebra Equation By Python
 0:04:29
Graphing solutions to two-variable linear equations example 1 | Algebra I | Khan Academy
 0:02:48
GCSE Maths - What are Quadratic Graphs? #76
 0:04:10
Creating a Table of Values from a Linear Equation
 0:04:31
Learn to graph a linear equation when it is in slope intercept form
 0:05:33
How to Draw the DEMAND CURVE (Using the DEMAND EQUATION) | Think Econ
 0:08:11
How to Graph a Linear Equation by Plotting Points (Using a table of values)
 0:02:37
Tutorial for writing the equation of a cubic function from a graph
Комментарии