filmov
tv
Your Doing Elliot Wave Wrong - Optimized Trading System

Показать описание
This video features a trading system that I actually traded on live Forex markets. It is based on Elliot Wave theory but does not follow Elliot Wave rules. This trading system has been extremely profitable, but it is very subjective.
In addition to reviewing the indicators, providing exact entry rules, defining the take profit and stop loss levels, and scoring the system on a scale of 1 to 10, I also share my 6 optimization tips that you can try in your own trading system development. Do not neglect back and forward testing, that is critical.
📒 Free Trading Journal, sign up for our Newsletter:
⏱️ Timestamps ⏱️
00:00 - Start
01:03 - Indicators
03:41 - Examples
11:09 - Results & Score
11:50 - Optimization
⚙️ System Specifics ⚙️
📛 System Name: Ride the 5th
🏆 Trader’s Landing Score: 9
🎹 Instrument: Any instrument
⌛ Time Frame: Any timeframe
👀 TradingView Indicators
Name: Relative Strength Index (RSI)
Inputs: Default
Style: Uncheck all boxes except for the RSI itself.
By: TradingView Built-In
Name: Stochastic RSI (Stoch RSI)
Inputs: Default
Style: Remove middle bands.
By: TradingView Built-In
☝️ Long Entry
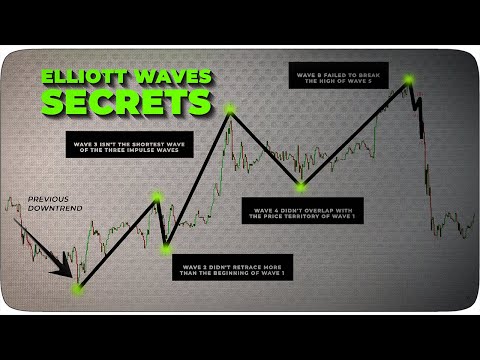
1. Identify a new bullish market sequence.
2. Draw Fibonacci projection from the beginning of the sequence to the first pullback.
3. Price breaks the 1.618 level.
4. Bullish divergence on wave 3.
5a. On the first pullback the Stoch RSI enters the oversold territory.
5b. The retrace is at least to the 0.236 level.
5c. If it goes past the .5 level the setup is off.
6. Enter on the first cross-up of the Stochastic RSI
7. The stop loss level is the 0.50 Fibonacci Level.
8. The target is the length of wave 1 projected from wave 4.
9. Setup is canceled if a new sequence is started in the opposite direction.
👇 Short Entry
1. Identify a new bearish market sequence.
2. Draw Fibonacci projection from the beginning of the sequence to the first pullback.
3. Price breaks the 1.618 level.
4. Bearish divergence on wave 3.
5a. On the first pullback the Stoch RSI enters the overbought territory.
5b. The retrace is at least to the 0.236 level.
5c. If it goes past the .5 level the setup is off.
6. Enter on the first cross-down of the Stochastic RSI
7. The stop loss level is the 0.50 Fibonacci Level.
8. The target is the length of wave 1 projected from wave 4.
9. Setup is canceled if a new sequence is started in the opposite direction.
🔥 Risk to Reward: Wave 1 Projection
🛑 Where to place stop-loss: 50% retrace of wave 3.
🚀 Where to take profits: Wave 1 retrace projected from wave 4.
______
⚠️Disclaimer: This content references opinion and is for information purposes only. Not intended to be investment advice.
Metatags
#StrategyReview #TradingSystem #ElliotWaveTheory
 0:14:21
Your Doing Elliot Wave Wrong - Optimized Trading System
 0:04:02
Problems with Elliot Wave Theory
 0:02:55
Why do you think Fibonacci Work? Problems with the Elliot Wave Theory
 0:16:49
Elliott Wave Trading Was Impossible, Until I Discovered These Price Action Clues (Simplified Guide)
 0:13:22
🔴 1-2-3 ELLIOTT WAVE (Simplified Guide) - The easiest way to MASTER Elliott Wave Theory
 0:15:31
The 5 Biggest mistakes you can make when trading with Elliott Wave
 0:08:01
Technical Analysis: Elliot Waves do not Work...
 0:13:13
Become An Expert Elliott Wave Trader INSTANTLY (The Ultimate CHEAT SHEET)
 0:17:47
S&P 500 & NASDAQ 100 / Elliott Wave Daily Update 10/16/2024 by Michael Filighera
 0:10:22
🔴 Most Effective 'ELLIOT WAVE and FIBONACCI' Price Action Trading Strategy (Wave Trading E...
 0:05:01
3 Tips To Learn Elliott Wave The Fastest
 0:11:21
Elliott Wave Theory: Common Mistakes Part 1
 0:24:01
Learn How To Avoid A Common Elliott Wave Trading Mistake Like A Pro
 0:35:48
ELLIOTT WAVE TRADING STRATEGY
 0:44:26
How the Wave Principle Helps You Make Smarter Trades - Jeffrey Kennedy
 0:15:24
ELLIOTT WAVE THEORY (Part 8): Guidelines & Patterns - Is your Elliott Wave Count Correct?
 0:16:29
The World's Simplest Explanation of the Elliott Wave Theory
 0:12:23
WHEN & HOW To Use ELLIOT WAVE THEORY
 0:16:23
How to count Elliott waves correctly.
 1:11:15
Most S&P 500 Elliott Wave Counts are Wrong
 0:21:54
Trading the markets with Elliott Wave and Fibonacci | How to trade with IG
 1:08:39
What are your Elliott Wave struggles ?
 0:29:02
Trading Corrective Patterns with Elliott Wave Theory (Simplified)
 1:09:09
All You Need to Know About Elliott Wave
Комментарии