filmov
tv
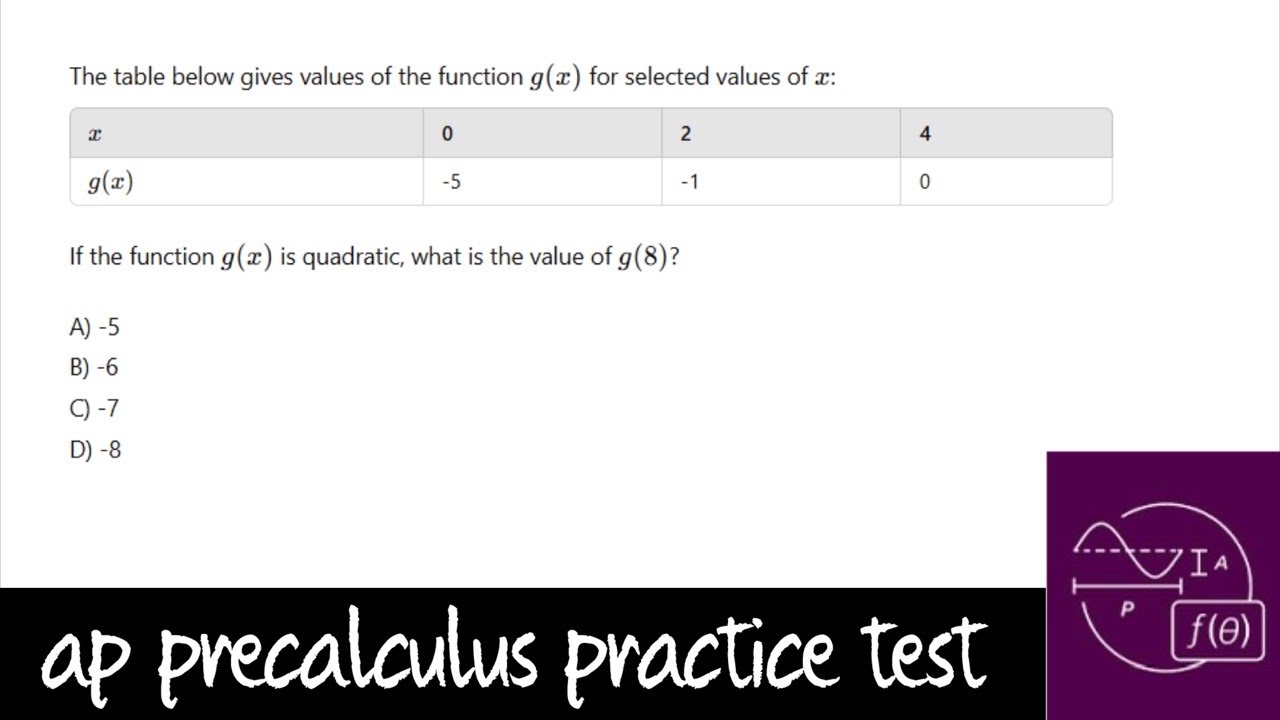
AP Precalculus Practice Test: Unit 1 Question #5 Use a Quadratic Table to Make Predictions
Показать описание
My AP Precalculus Practice Tests are carefully designed to help students build confidence for in-class assessments, support their work on AP Classroom assignments, and thoroughly prepare them for the AP Precalculus exam in May.
**AP Precalculus Practice Test: Unit 1, Question #5: Use a Quadratic Table to Make Predictions**
This question involves using a table of values that represents a quadratic function and making predictions based on that data. Here's how to approach it in detail:
### 1. **Understanding the Quadratic Function**:
A quadratic function is typically in the form:
\[
y = ax^2 + bx + c
\]
The graph of a quadratic function is a parabola, which can either open upwards or downwards. The data provided in the table corresponds to points on the parabola.
### 2. **Using the Table to Identify the Pattern**:
Given a quadratic table, the goal is to predict future values of the function based on the existing data. To do this effectively, follow these steps:
#### a. **Examine the Table**:
The table will contain a set of x-values and their corresponding y-values. For example:
| x | y |
|----|----|
| 1 | 3 |
| 2 | 7 |
| 3 | 13 |
| 4 | 21 |
#### b. **Check for the Quadratic Pattern**:
- For a quadratic function, the **second differences** between the y-values should be constant.
- Calculate the first differences (subtract the y-values of consecutive x-values):
- \( 7 - 3 = 4 \)
- \( 13 - 7 = 6 \)
- \( 21 - 13 = 8 \)
- Then, calculate the second differences:
- \( 6 - 4 = 2 \)
- \( 8 - 6 = 2 \)
Since the second differences are constant (\( 2 \)), the table represents a quadratic function.
#### c. **Make Predictions**:
To predict future values, follow these steps:
1. **Use the constant second difference** to find the next first difference.
- The second difference is \( 2 \), so continue the pattern of first differences by adding \( 2 \) to the last first difference:
- The last first difference was \( 8 \), so the next first difference will be \( 8 + 2 = 10 \).
2. **Add the new first difference to the last y-value** to predict the next y-value.
- The last y-value is \( 21 \), so add the predicted first difference:
- \( 21 + 10 = 31 \).
Thus, the predicted value for \( x = 5 \) is \( 31 \).
#### d. **Continue the Prediction Process**:
To predict further values, repeat the steps: calculate the next first difference, then add it to the last y-value.
### 3. **Example**:
Given the table:
| x | y |
|----|----|
| 1 | 2 |
| 2 | 6 |
| 3 | 12 |
| 4 | 20 |
#### Step 1: Find the first differences:
- \( 6 - 2 = 4 \)
- \( 12 - 6 = 6 \)
- \( 20 - 12 = 8 \)
#### Step 2: Find the second differences:
- \( 6 - 4 = 2 \)
- \( 8 - 6 = 2 \)
Since the second differences are constant, this is a quadratic function.
#### Step 3: Make a prediction for \( x = 5 \):
- The next first difference is \( 8 + 2 = 10 \).
- Add the new first difference to the last y-value: \( 20 + 10 = 30 \).
Thus, the predicted value for \( x = 5 \) is \( y = 30 \).
### 4. **Conclusion**:
To make predictions from a quadratic table, follow these steps:
1. Verify the table represents a quadratic function by checking for constant second differences.
2. Use the constant second difference to predict the next first difference.
3. Add the new first difference to the last y-value to predict the next y-value.
4. Repeat the process for additional predictions.
By recognizing the quadratic pattern and applying these steps, you can make accurate predictions based on the data in the table.
I have many informative videos for Pre-Algebra, Algebra 1, Algebra 2, Geometry, Pre-Calculus, and Calculus. Please check it out:
/ nickperich
Nick Perich
Norristown Area High School
Norristown Area School District
Norristown, Pa
#math #algebra #algebra2 #maths #math #shorts #funny #help #onlineclasses #onlinelearning #online #study
 1:12:46
 0:18:59
 0:20:35
 0:42:35
 0:09:45
 0:04:12
 1:54:59
 0:02:26
 0:04:02
 1:14:14
 0:27:40
 0:01:05
 0:57:24
 0:01:20
 0:00:49
 0:04:56
 3:28:30
 0:01:39
 0:01:01
 0:02:07
 1:46:11
 0:02:00
 0:08:23
 0:57:14