filmov
tv
AP Precalculus Practice Test: Unit 1 FRQ#4 TI-84+ Cubic Model, Regression, Average Rate of Change
Показать описание
My AP Precalculus Practice Tests are carefully designed to help students build confidence for in-class assessments, support their work on AP Classroom assignments, and thoroughly prepare them for the AP Precalculus exam in May.
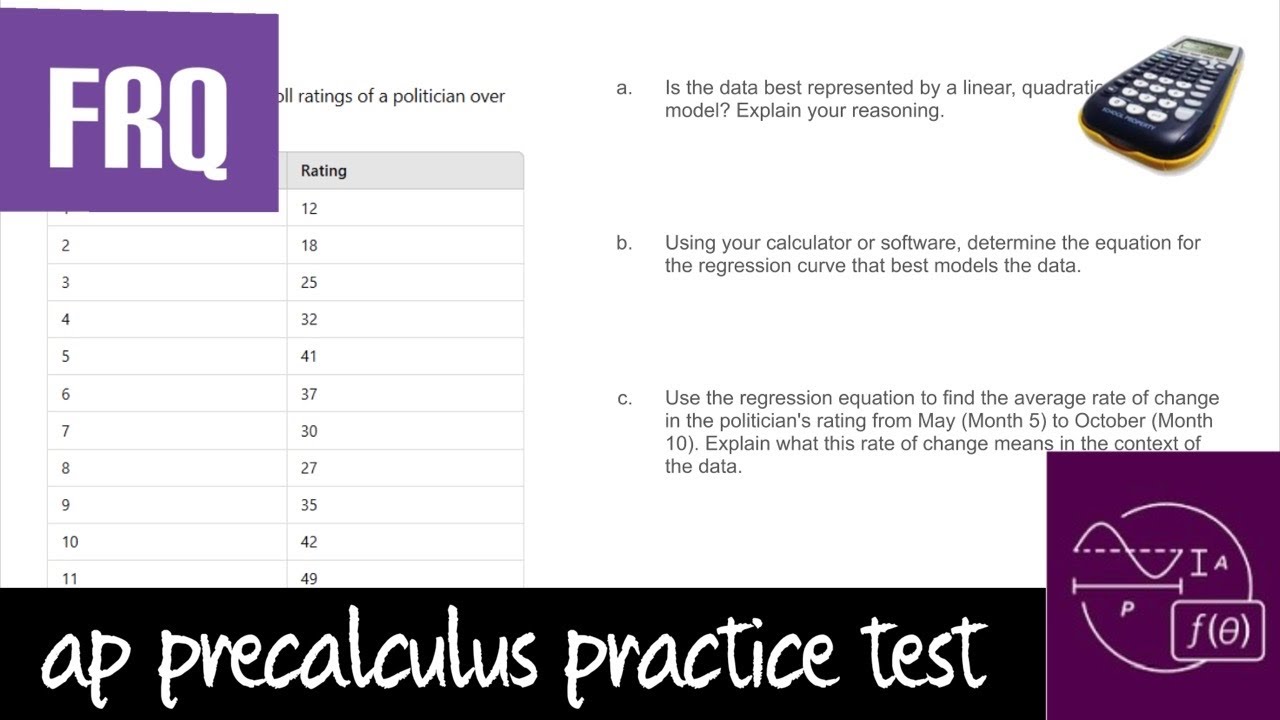
For AP Precalculus Unit 1, FRQ #4, you’ll be using the TI-84+ calculator to find a **cubic model** through **regression** and calculating the **average rate of change**. Here’s an outline of the key steps:
### 1. **Setting Up the Data for a Cubic Regression Model**
- Enter your data points into the calculator by pressing `STAT`, selecting `EDIT`, and inputting \( x \)-values in `L1` and corresponding \( y \)-values in `L2`.
- These data points should represent a set of values that you suspect can be modeled by a cubic function.
### 2. **Performing a Cubic Regression**
- After entering the data, press `STAT`, scroll to `CALC`, and select `CubicReg` (option 6 or 7, depending on the model).
- Choose `L1` and `L2` for the x- and y-lists, then calculate to generate the **cubic regression model**. This will give you a function of the form \( f(x) = ax^3 + bx^2 + cx + d \), where the calculator displays the values for \( a \), \( b \), \( c \), and \( d \).
- This model represents a curve that fits the given data as closely as possible using a cubic function.
### 3. **Interpreting the Cubic Model**
- Use the model to make predictions or interpret trends in the data.
- You can also graph the function along with the data points by inputting the regression equation into the `Y=` menu and setting an appropriate window to visualize the fit.
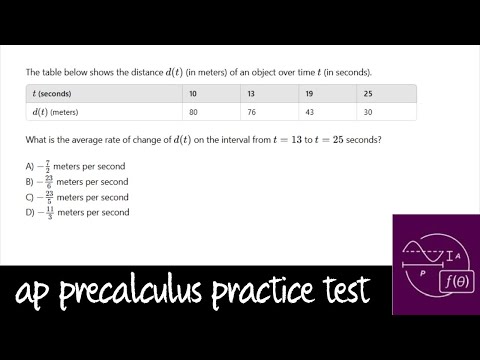
### 4. **Calculating the Average Rate of Change**
- The **average rate of change** of the function over an interval provides the “average slope” between two points, \( (x_1, f(x_1)) \) and \( (x_2, f(x_2)) \).
- To find this, use the formula \[ \text{Average Rate of Change} = \frac{f(x_2) - f(x_1)}{x_2 - x_1} \].
- Substitute the values from your model to find \( f(x_1) \) and \( f(x_2) \), then calculate the difference in function values and divide by the difference in \( x \)-values.
- This result gives a single value representing how much the function's output changes on average as \( x \) increases from \( x_1 \) to \( x_2 \).
### Putting It All Together
For this question:
1. **Enter and fit the data** using the cubic regression function on the TI-84+ to find a model that best represents the data trend.
2. **Interpret the model** by analyzing the resulting equation and considering its usefulness for prediction.
3. **Calculate the average rate of change** over a specified interval by substituting into the average rate of change formula, allowing you to describe how the function behaves over that interval.
This approach allows you to analyze data with a cubic model, calculate meaningful changes over intervals, and understand the data’s behavior using both regression and rate analysis.
I have many informative videos for Pre-Algebra, Algebra 1, Algebra 2, Geometry, Pre-Calculus, and Calculus. Please check it out:
/ nickperich
Nick Perich
Norristown Area High School
Norristown Area School District
Norristown, Pa
#math #algebra #algebra2 #maths #math #shorts #funny #help #onlineclasses #onlinelearning #online #study
 1:12:46
 0:18:59
 0:42:35
 0:57:24
 0:09:45
 1:54:59
 0:20:35
 0:02:26
 2:11:30
 1:14:14
 0:01:20
 0:01:05
 0:04:02
 0:02:00
 0:01:30
 1:46:11
 3:28:30
 0:08:23
 0:38:27
 0:02:01
 0:01:41
 1:09:52
 0:01:49
 0:00:47