filmov
tv
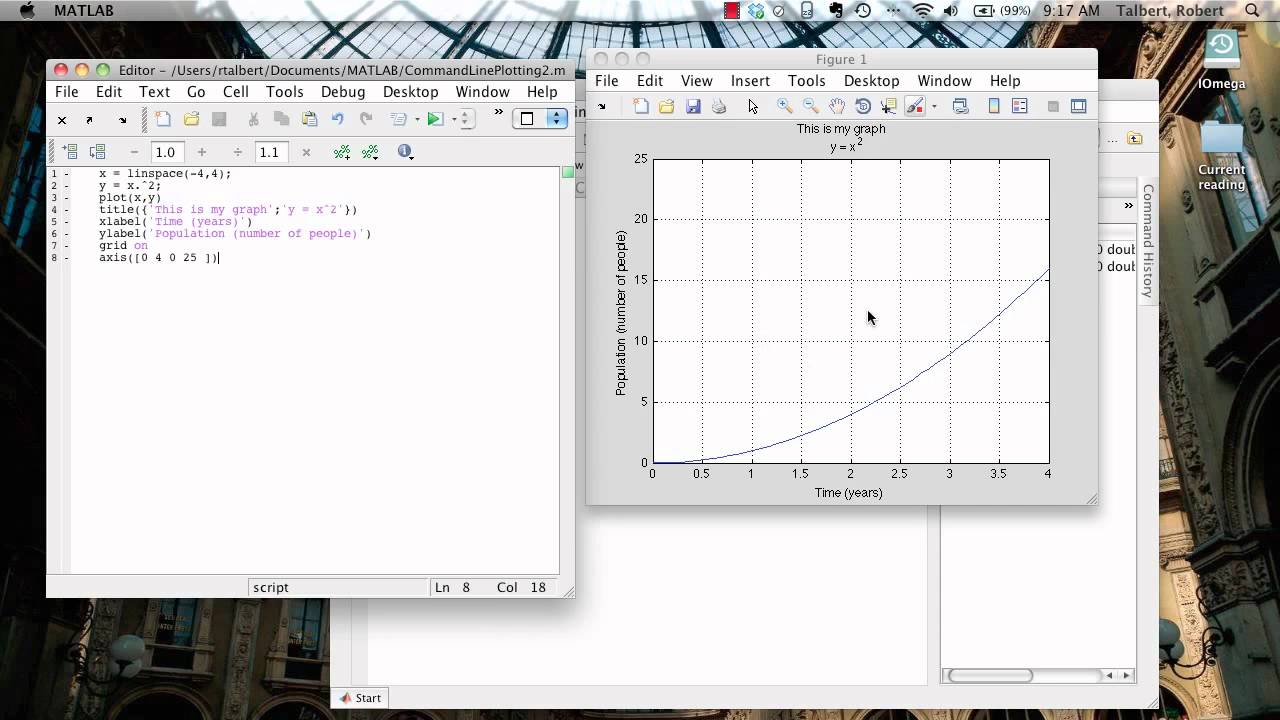
MATLAB Command Line Plotting, Part 2
Показать описание
Part 2 of a series of screencasts on plotting in MATLAB from the command line or an M-file. This one covers labels: graph titles, axis labels, tick marks, grids, and legends.
 0:09:54
MATLAB Command Line Plotting, Part 1
 0:09:36
MATLAB Command Line Plotting, Part 3
 0:07:31
MATLAB Command Line Plotting- Less simple example
 0:09:47
MATLAB Command Line Plotting, Part 2
 0:05:23
MATLAB Command Line Plotting: Simple example
 0:05:57
Matlab Tutorial #3: Plotting, part 1
 0:09:14
Matlab Tutorial - 60 - Plotting Functions
 0:21:04
Formating of Matlab Plot Using Commands
 0:07:08
How to Plot 2D Contour in MATLAB | Complete Guide for Beginners
 0:03:55
MATLAB Plot Function Tutorial
 0:12:06
Matlab Tutorial: Introduction To Plotting Figures
 0:16:00
Graphing in Matlab | Plotting in Matlab| Matlab Course | Electrical Engineering Education
 0:04:26
MATLAB plotting
 0:03:00
How to Use Basic Plotting Functions
 0:00:54
2D plot with function handle in Matlab#matlab#maths
 0:12:53
Simple Tutorial on Plotting Data with Matlab, Part A
 0:00:31
#Shorts #matlabtutorials - Plot Option - X Label & Y Label #commandstutorial #operators
 0:00:15
Correlation of two signals Matlab code
 0:13:51
MATLAB Intro - Arrays, Figures, Plots, etc.
 0:00:22
Plotting sin function in MATLAB #matlab #maths #graph #coding #sin #cos #matlabcode
 0:00:54
🟢How to scale drawing in the drawing sheet ratio #shorts #design #cad
 0:10:26
MATLAB - Annotated plots
 0:04:15
MATLAB 2D Line Plot
 0:01:00
Multiple 2D plot in matlab | Make multiple 2d plot on same figure | Matlab plot
Комментарии