filmov
tv
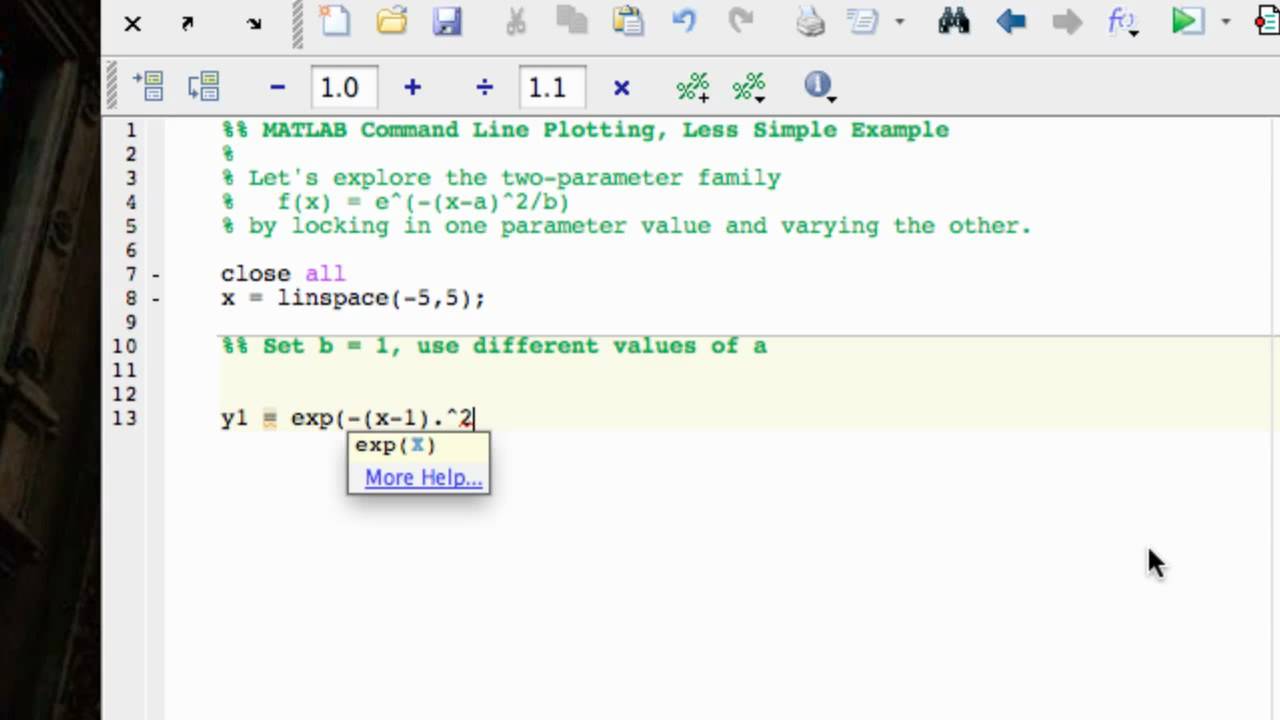
MATLAB Command Line Plotting- Less simple example
Показать описание
More complicated example of command line/M-file plotting in MATLAB. Here we create a 1x2 subplot of graphs, each of which contains multiple functions with style changes, aimed at understanding the behavior of a two-parameter family of functions.
 0:07:31
MATLAB Command Line Plotting- Less simple example
 0:09:54
MATLAB Command Line Plotting, Part 1
 0:09:36
MATLAB Command Line Plotting, Part 3
 0:05:23
MATLAB Command Line Plotting: Simple example
 0:21:04
Formating of Matlab Plot Using Commands
 0:09:47
MATLAB Command Line Plotting, Part 2
 0:00:54
2D plot with function handle in Matlab#matlab#maths
 0:02:39
How to make a line in Matlab | making line in axes in Matlab | making line in matlab GUI
 0:12:06
Matlab Tutorial: Introduction To Plotting Figures
 0:08:19
Importing to Matlab via the Command Line
 0:00:29
Learn 10 Special Plot Types in 30 seconds | MATLAB #short Tutorial
 0:04:28
How to Plot Straight Line in Matlab
 0:04:30
Straight line in MATLAB(EASIEST WAY TO DRAW)
 0:03:43
Plotting functions in MATLAB with EZPLOT
 0:05:24
Week 5 - Part 3: Plotting Functions
 0:08:59
1. Matlab Tutorial - Command Line Interface
 0:01:53
How to plot a time series in MATLAB
 0:06:22
MATLAB Command line
 0:10:28
ENGIN 77 - Linear Regression using MATLAB
 0:02:54
Plotting multiple sine curves on the same figure using MATLAB
 0:04:52
2D Plotting in MATLAB | MATLAB Tutorial for Beginners
 0:17:39
2 1 MATLAB Graphs and Files
 0:41:18
Graph Plotting in MATLAB for Physics students
 0:03:39
using subplot command in Matlab.avi
Комментарии