filmov
tv
Ideal Gas Graph Sketching

Показать описание
In this video we want to learn how to use the Ideal Gas Equation to sketch graphs of an ideal gas.
Let's first take a look at the Ideal Gas Equation, PV = nRT
where:
P is pressure in Pa,
V is volume in m3,
n is moles of gas,
R is gas constant 8.31 J K-1 mol-1, and
T is temperature in K.
For graph sketching we have to use the Ideal Gas Equation and write the equation in terms of y = mx to work out the relationship between the x and y terms.
Let's have a few examples for a fixed mass of ideal gas.
1. P against V at constant T
First we need to find all the constant terms and combine them together.
Since mass is fixed and molar mass of an ideal gas is constant, number of mole, n, will be constant.
R and T are constants too therefore nRT is constant.
We can rearrange the equation where P is the y term and V is the x term to get the inverse relationship between P and V.
Therefore P against V will be an inverse graph.
2. P against 1/V at constant T
We already know P is inversely related to V so P is directly related to 1/V.
Therefore P against 1/V will be a straight line passing through origin, with gradient = k = nRT
3. PV against P at constant T
Again we know PV = nRT = k. Therefore PV will always be k regardless of the value of P.
This means PV against P will be a horizontal line which cuts the PV axis at k = nRT.
For the detailed step-by-step discussion on how to sketch the graph of an ideal gas using the Ideal Gas Equation, check out this video!
Topic: Gaseous State, Physical Chemistry, A Level Chemistry, Singapore
Found this video useful?
Please LIKE this video and SHARE it with your friends!
Any feedback, comments or questions to clarify?
Suggestions for new video lessons?
Drop them in the COMMENTS Section, I would love to hear from you!
Do check out the following for more video lessons:
-~-~~-~~~-~~-~-
Please watch my latest video: "2019 P1 Q2 - Deflection of Charged Particle in Electric Field"
-~-~~-~~~-~~-~-
 0:08:29
Ideal Gas Graph Sketching
 0:04:05
23 Drawing Graphs using pV=nRT
 0:20:17
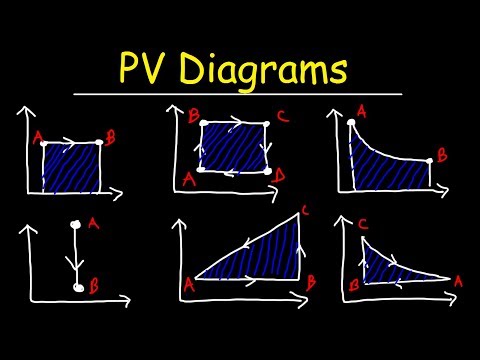
PV Diagrams, How To Calculate The Work Done By a Gas, Thermodynamics & Physics
 0:00:15
Boyle’s Law
 0:07:54
S1.5.1 and S1.5.2 Ideal gases and deviation from ideal gas behaviour
 0:02:41
1.3 Ideal gases (SL)
 0:10:23
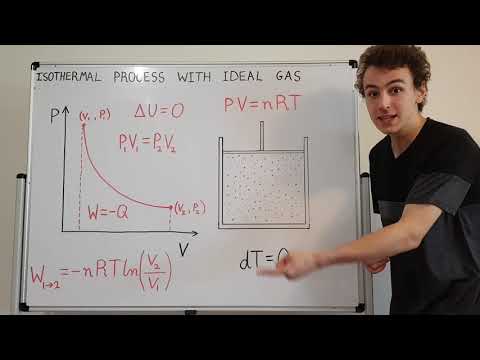
Quantitative Description of Isothermal (Constant Temperature) Process with Ideal Gas on P-V Diagram
 0:07:53
Thermodynamics and P-V Diagrams
 0:10:01
Calculating change in Entropy of an ideal gas Thermodynamics
 0:24:17
Non-Ideal Gases for Engineers
 0:14:03
The Ideal Gas Law, Moles and Ideal Gases (A-Level IB Chemistry)
 0:05:28
The Ideal Gas Equation | Thermodynamics | (Solved Examples)
 0:03:51
Ideal gases Grade 11 Chemistry November 2019
 0:13:24
T-v Diagrams and PROPERTY TABLES for Thermodynamics in 13 Minutes!
 0:29:00
IDEAL GAS EQUATION AND GRAPHS
 0:23:31
The Ideal Gas Law: pV = nRT - IB Physics
 0:12:48
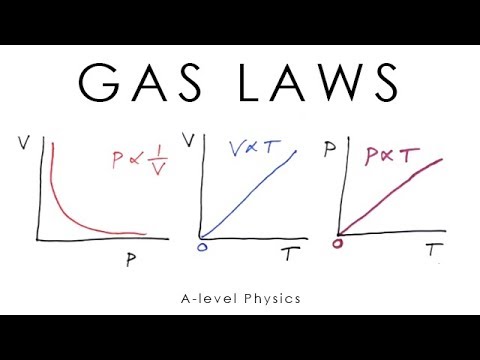
Gas Laws - A-level Physics
 0:01:47
Which one of the following is the correct PV vs P plot at constant temperature for an ideal gas
 0:02:36
Gas Law Graphs: Boyle's Law, Charles' Law, Gay-Lussac's Law, Avogrado's Law
 0:25:13
Gas laws, Kinetic theory of ideal gas, IB Physics, Modelling of gas, Thermal physics
 0:04:23
Pressure vs Volume Graph 1 Video
 0:05:01
How to Investigate the Relationship between Pressure and Volume using Boyle's Law
 0:12:44
Thermodynamics - 3-7 Ideal Gas Equation with compressibility factor
 0:02:08
Boyle's Law - A Level Physics
Комментарии