filmov
tv
COVID-19 Simulation with EpiGraph

Показать описание
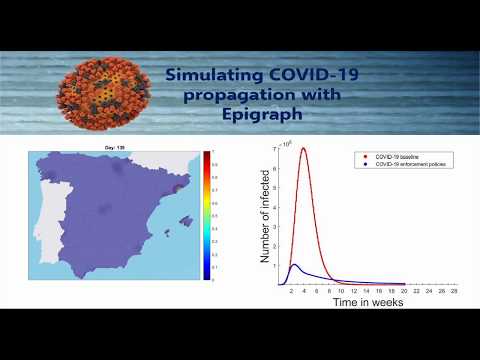
This animation shows different stages of the simulation of an outbreak of COVID-19 for the 62 most populated cities in Spain comprising a total of 20 million inhabitants. We have used censal data from the Spanish Office for Statistics and the Spanish Ministry of Health for the social modelling. The simulation shows the total number of infectives including the symptomatic and asymptomatic cases. Note that these number are much bigger than the official number of cases. The beginning of week 1 corresponds to 17th of March of 2020.
Two scenarios are compared:
•Baseline: no restrictions are taken, the virus freely propagates throughout the whole simulation
•Social enforcement policies: starting from week 1, including closure of schools, working from home, social distancing and travel restrictions
EpiGraph was originally designed in the Computer Architecture research group of University Carlos III and later, developed further with the collaboration with Barcelona Supercomputing Center.
 0:01:05
COVID-19 Simulation with EpiGraph
 0:00:57
COVID-19 simulation by EpiGraph.
 0:01:18
COVID-19 simulation with Epigraph. Peak 10% large
 0:01:05
COVID-19 simulation in Spain
 0:01:19
COVID-19 simualtion with EpiGraph Peak 10%
 0:33:14
Geo-spatial-temporal COVID-19 Simulations and Visualizations Over USA
 0:11:32
COVID Chronicles- Continulus, BACCN and COVID Simulation video
 8:07:07
COVID-19 Simulation Summit
 0:02:58
Interactive Simulation of COVID-19 Outbreak and Quarantine in Urban Environment
 0:09:38
Novel Coronavirus (COVID-19): Significance of Lockdown with Statistical Simulations
 0:00:49
Simulation of COVID-19
 0:09:16
Why Should We Shelter In: A Computer Simulation?
 0:55:04
High Performance Computing for Accelerating Anti-COVID Research & Development
 0:00:13
COVID-19. Experiment 'Mobility'. Agent-Based Simulation in Python. [mobility 2]
 0:07:57
Coronavirus Prediction with Time Series Techniques | Learn Time series with covid-19 Prediction
 1:28:23
COVID-19 in Southeast Asia: insights for a post-pandemic world | LSE Online Event
 0:00:39
demographic affect by COVID-19
 0:08:29
The Copley Consulting Group Tracking COVID-19 with Qlik Analytics
 0:11:35
Dalton Covid 19 Mapping
 0:05:26
Taking Coronavirus Perspective with a Rosling-inspired Factfulness approach
 0:00:16
Epidemic Simulation
 0:10:01
Plague, INC Game (PC) Coronavirus simulation and prediction
 0:20:20
Mapping COVID-19 (novel coronavirus) case and mortality data in QGIS
 1:02:54
Harnessing the Wisdom of a Crowd of Probabilistic Forecasters
Комментарии