filmov
tv
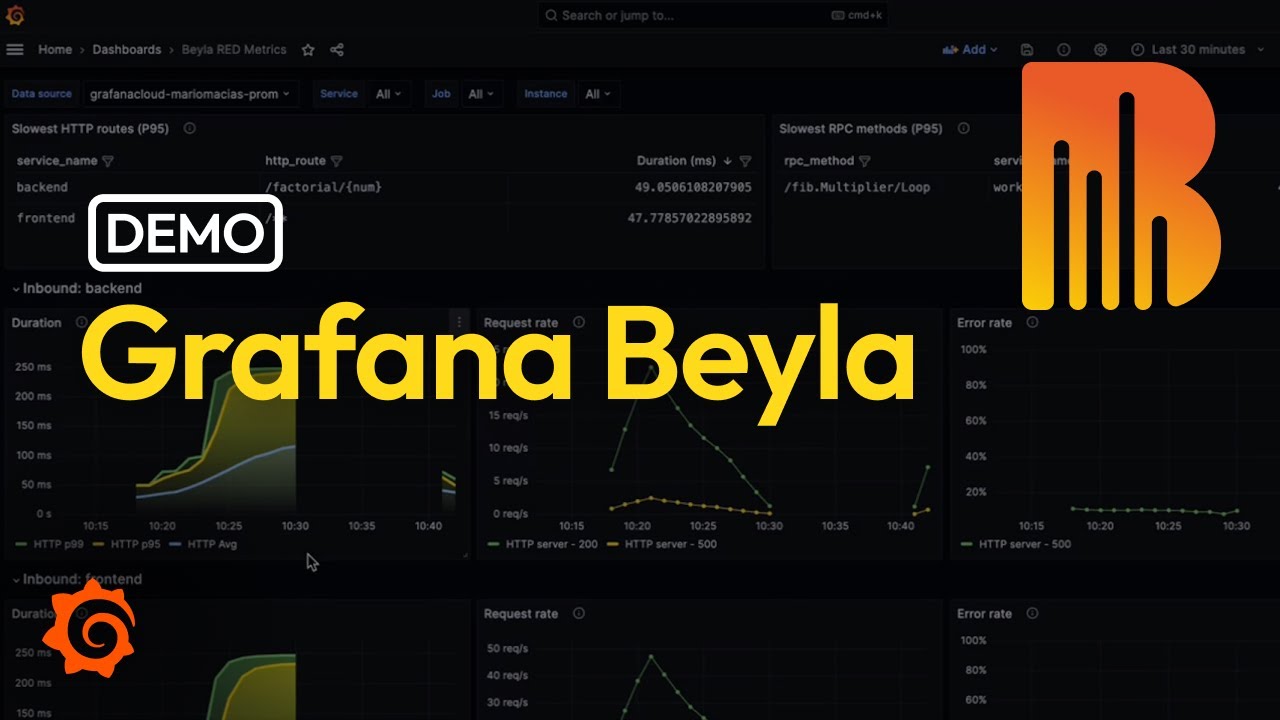
Zero-code application observability with Grafana Beyla and eBPF | Demo

Показать описание
The eBPF-based OSS auto-instrumentation tool Grafana Beyla makes it easier to get started with application observability. Beyla provides RED (Rate, Errors, Duration) metrics through OpenTelemetry or Prometheus for your existing web services, whichever language they are written in. You don’t need to change any line of application code or configuration; you only need to deploy the Beyla in the same host as the service that you want to monitor.
Collecting monitoring data with the eBPF auto-instrument tool has very low overhead, and allows you to capture data about your runtime, which is impossible with manual code instrumentation. Watch this in-depth demo of how to use Grafana Beyla to get started with application observability.
Chapters:
2:42: Deploying Grafana Beyla as a Daemonset
3:29: Selecting the executables you want to instrument
4:20: Providing extra information (extra configuration or hints)
8:37 Visualizing Beyla in Grafana
9:55 Using Application Observability
Zero-code application observability with Grafana Beyla and eBPF | Demo
How to Unify Your Application and Infrastructure Observability With Grafana and Beyla
Grafana Beyla Application Monitoring in Kubernetes | Grafana Beyla Example |eBPF Tool Observability
Beyla: Zero-Code Distributed Traces & Metrics for Your Microservices with eBPF | GrafanaCON 2024
Observability with Grafana | 5. Monitoring with Metrics Using Grafana Mimir and Prometheus
Grafana OTEL Application Observability Demo
What is Observability? | Grafana for Beginners Ep. 1
Observability with Grafana | 6. Tracing Technicalities with Grafana Tempo
Replay Day 3 DevOps: Git, Jenkins, Docker, Kubernetes, Terraform, Ansible, Prometheus, Grafana
Observability with Grafana | 4. Looking at Logs with Grafana Loki
Application Observability and Beyla Demo | ObservabilityCON 2023
RedisConf 2021: Grafana on the open observability platform
Migrating to Grafana Cloud: Observability with Dashboards as Code at ASAPP | ObservabilityCON 2024
PromCon 2023 - Zero-code application metrics with eBPF and Prometheus
How to Achieve Observability as Code with Grafana | LiveRamp at ObservabilityCON on the Road 2024
Observability vs. APM vs. Monitoring
Get started with observability with Grafana, Loki, and Promtail
On the OSS Path to Full Observability with Grafana - David Kaltschmidt, Grafana Labs
[Statscraft Track] Grafana as Code-An Open Source Observability Solution, Simon Shkilevich (VI Labs)
Scaling Monitoring & Observability for a Software Platform with Grafana Cloud | Builder.ai | Gra...
Model driven observability with Prometheus, Alertmanager, Grafana and Loki
Grafana Explained in Under 5 Minutes ⏲
Spring Boot Microservices Tutorial Part 12 - Observability with Grafana Stack
Frontend Observability using Grafana Faro | Real User Monitoring by Grafana Faro | Faro Tutorial
Комментарии
 0:12:34
 0:25:01
 0:17:39
 0:15:28
 0:00:47
 0:26:01
 0:07:59
 0:00:48
 2:10:34
 0:00:48
 0:20:06
 0:08:56
 0:29:25
 0:27:33
 0:35:06
 0:09:41
 0:05:19
 0:35:07
![[Statscraft Track] Grafana](https://i.ytimg.com/vi/F8Zr-xvCDUw/hqdefault.jpg) 0:25:16
0:25:16
 0:17:41
 0:43:04
 0:04:32
 0:41:30
 0:24:03