filmov
tv
Plotting Time Series in R: A COVID-19 Example

Показать описание
Here I walk through an example showing how I'd plot time-series data in R using the ggplot2 package. In this plot, we look at coronavirus COVID-19 **new** daily cases in the United States and Australia.
🎉 *Enjoyed this video?* Leave a comment below to share what you liked the most!
0:00 Intro
0:15 Download the data
1:00 Read the data into R
1:40 Re-arrange the data to prepare it for plotting
5:18 Plot United States cumulative cases
6:00 Plot United States new daily cases
7:13 "Beautify" the plot (add labels etc.)
9:55 Multiple lines (Australia & US new daily cases)
11:05 Split facets using facet_wrap()
12:15 Remove the legend
 0:08:13
Time series Line plot in ggplot2 for single variable |R tutorial for beginners
 0:11:22
Plotting time series data in #R#software #sokora
 0:05:07
Plotting a Time Series graph on R Studio
 0:10:19
Plotting Time Series in R (Bonus: Cyberpunk ggplot theme)
 0:11:44
How to plot a time series in R with ggplot2 in 2020 (coronavirus example)
 0:08:43
How to plot time series data in R
 0:07:56
Introduction To Time Series In R
 0:08:42
Plotting multiple timeseries Variables on the basis of dates in or time in one go using R
 0:11:10
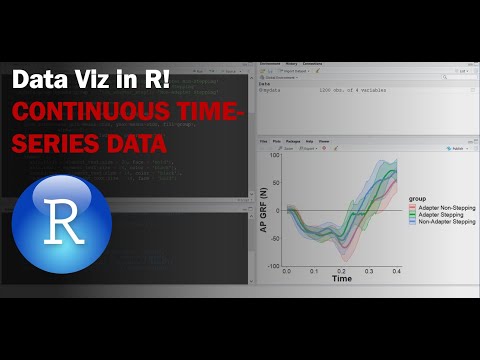
Data Visualization in R: Plotting Time-Series Data in ggplot2
 0:03:17
Intro to Data Analysis with R - Plotting a Time-Series
 0:04:43
Draw Multiple Time Series in Same Plot in R | Using Base R & ggplot2 | lines & geom_line Fun...
 0:05:53
How to Make a Time Series Plot with ggplot2 in R - Demonstration
 0:07:31
R Programming Plotting time series data using data
 0:04:28
Time Series Plot - ggplot2, Part 1 | DS4B 101-R Course
 0:12:42
Plotting Time Series in R: A COVID-19 Example
 0:10:41
Time series data in R - Creating a scatter plot with dates on the x axis - S06
![R Tutorials [19]](https://i.ytimg.com/vi/phKhGEUuZTU/hqdefault.jpg) 0:04:08
0:04:08
R Tutorials [19] Time Series Plotting
 0:03:00
Data Visualization in R | R Plotly Double Y-Axis Line Plot | Time Series Visualization
 0:03:46
S2 L7 Plotting different Trend lines with R
 0:15:44
Time series in R | Video-2 | Plotting, Computing Growth rates and Forecasting Time series data.
 0:14:27
Step by Step guide to create line plot in ggplot2 using time series data| Line Plot in R
 0:09:17
Time Series plotting and Displaying multiple plots (graphs) in a single output using R
 0:07:22
How to Make a Time Series Plot with Error Bars using ggplot2 in R - Demonstration
 0:06:49
Animated Visualizations with R | #1 Time series Plot
Комментарии