filmov
tv
Draw Multiple Time Series in Same Plot in R | Using Base R & ggplot2 | lines & geom_line Functions

Показать описание
R code of this video:
ts1 = 1:25 + rnorm(25),
ts2 = 30:6 + runif(25, 0, 10),
ts3 = rnorm(25, 5, 5)))
plot(data$year, # Draw first time series
data$ts1,
type = "l",
col = 2,
ylim = c(- 15, 40),
xlab = "Year",
ylab = "Values")
lines(data$year, # Draw second time series
data$ts2,
type = "l",
col = 3)
lines(data$year, # Draw third time series
data$ts3,
type = "l",
col = 4)
legend("topright", # Add legend to plot
c("ts1", "ts2", "ts3"),
lty = 1,
col = 2:4)
library("reshape2") # Load reshape2 package
library("ggplot2") # Load ggplot2 package
ggplot(data_long, # Draw ggplot2 time series plot
aes(x = year,
y = value,
col = variable)) +
geom_line()
Follow me on Social Media:
 0:04:43
Draw Multiple Time Series in Same Plot in R | Using Base R & ggplot2 | lines & geom_line Fun...
 0:10:23
How to draw a time series in R using ggplot2? | Single, Multiple | StatswithR | Arnab Hazra
 0:01:57
Plot Multiple Lines in Excel
 0:14:27
Step by Step guide to create line plot in ggplot2 using time series data| Line Plot in R
 0:05:53
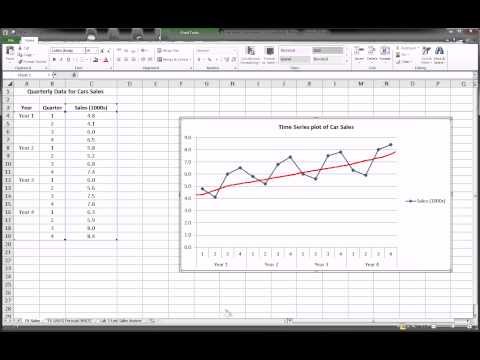
Creating a Time-Series Plot in Excel
 0:21:12
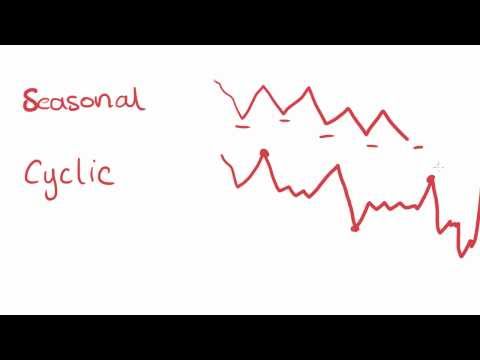
Maths Tutorial: Patterns and Trends in Time Series Plots (statistics)
 0:01:31
Time Series Plot
 0:09:06
Multiple Line Graphs in The Same Plot in R💯☑️ ||#visualization ||#ggplot2
 0:14:52
Top 10 Best Fantasy Novels: 1990-1999 (A Journey Thru Time Series)
 0:03:44
How to Add MULTIPLE Sets of Data to ONE GRAPH in Excel
 0:07:29
What is Time Series Analysis?
 0:02:36
EXCEL TUTORIAL-HOW TO DRAW MULTIPLE CURVE IN EXCEL
 0:04:29
How to quickly make multiple charts in excel
 0:05:40
Time Series Graphs using Minitab 19
 0:13:28
How to draw a line graph using ggplot with R programming. Plots and graphs to visualize data.
 0:03:54
Time Series Chart in PowerBI | PowerBI Visualization | Line Chart
 0:18:06
Excel - Time Series Forecasting - Part 1 of 3
 0:07:54
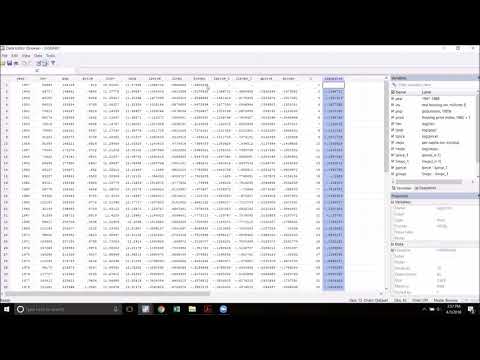
Time Series Data in Stata
 0:07:57
Matplotlib Series Part#17 - Creating Multiple Subplots
 0:02:49
How to create Line Chart to compare Sales of Multiple Years in PowerBI | MI Tutorials
 0:13:52
#14 Time series data visualization in python | Analyze financial data | Matplotlib tutorial 2021
 0:00:16
How to eat Roti #SSB #SSB Preparation #Defence #Army #Best Defence Academy #OLQ
 0:00:20
1st yr. Vs Final yr. MBBS student 🔥🤯#shorts #neet
 0:02:55
Excel Basics - Video Tutorial How To Graph Two Sets of Data On One Graph
Комментарии