filmov
tv
Making a Compounding Interest Calculator in Excel

Показать описание
👍 Ready made and ready to use.
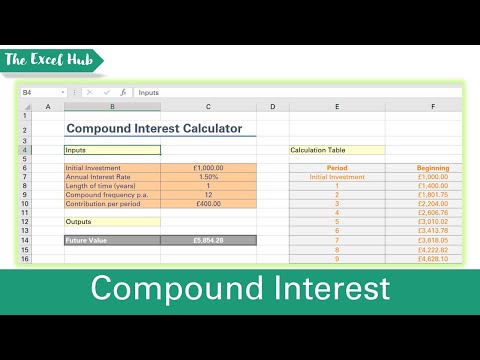
Follow along to make your own template on the EIGHTH WONDER of the world - Compounding. It shows you how long it will take you to become a millionaire. The chart also uses dynamic Named Ranges, using Offset, to make a beautiful chart that updates automatically.
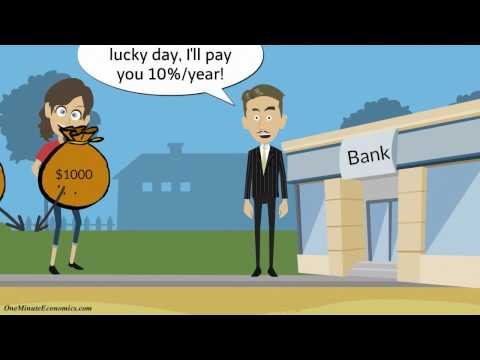
Compounding is where you invest some money, get a return (say 10%), then reinvest your earnings. Over time your amount grows, so 10% of your increased amount is higher. This starts out small but soon grows exponentially to make you a millionaire.
A Compounding Interest Calculator shows you how much you need to invest, at what percentage, and over what period of time, and how much your investment will grow to.
#Excel #Millionaire
Timestamps:
00:00 Intro and Compounding Overview
01:55 Blank Template
02:54 Total Amount Contributed
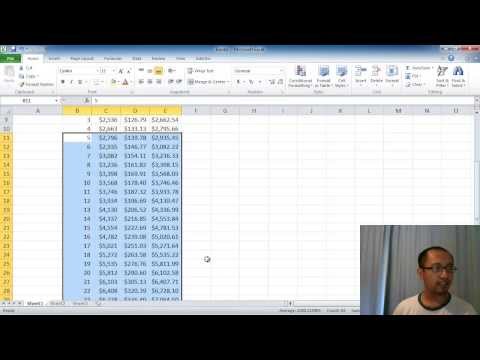
03:21 Compounding Table
05:20 Final Amount
06:30 Creating a named range
07:35 Compounding Chart
Follow along to make your own template on the EIGHTH WONDER of the world - Compounding. It shows you how long it will take you to become a millionaire. The chart also uses dynamic Named Ranges, using Offset, to make a beautiful chart that updates automatically.
Compounding is where you invest some money, get a return (say 10%), then reinvest your earnings. Over time your amount grows, so 10% of your increased amount is higher. This starts out small but soon grows exponentially to make you a millionaire.
A Compounding Interest Calculator shows you how much you need to invest, at what percentage, and over what period of time, and how much your investment will grow to.
#Excel #Millionaire
Timestamps:
00:00 Intro and Compounding Overview
01:55 Blank Template
02:54 Total Amount Contributed
03:21 Compounding Table
05:20 Final Amount
06:30 Creating a named range
07:35 Compounding Chart
 0:11:23
Making a Compounding Interest Calculator in Excel
 0:06:08
Compound Interest Calculator In Excel - Calculate Savings Using FV Function
 0:02:03
How To Calculate Compound Interest (By Hand) In Excel Explained
 0:01:28
Compound Interest Explained in One Minute
 0:04:01
How Does Compound Interest Work?
 0:00:23
How To Use Acorns Compound Interest Calculator
 0:13:49
Building a Compound Interest Calculator | React Tutorial
 0:07:38
How to create compounding interest spreadsheet on Numbers app/ Macbook
 0:00:32
How Much SCHD You Need to Make $3000/Month |The Ultimate Dividend Strategy
 0:04:52
This Is The Power Of Compound Interest (And How It Works)
 0:08:37
Microsoft Excel lesson 2 - compound interest calculator (absolute referencing, fill down)
 0:07:36
Python compound interest calculator 💵
 0:09:48
Power of Compounding Using The 8-4-3 Rule (Compound Your Interest)
 0:00:22
The Power of Compound Interest
 0:00:45
Compound interest Calculator | Advance Excel Formula | MyExcelGeeks
 0:00:10
The Power of Compound interest will make you Rich fast! 💰 #investing #stocks #compoundinterest
 0:05:51
Compound Interest Calculator Sheet
 0:01:58
Compound Interest Formula
 0:06:10
How to make a compound interest calculator using Python
 0:00:32
Compound Interest Explained
 0:04:37
Compound Interest Calculator Template Excel
 0:13:29
How to calculate Compound Interest in Excel - Formula with Examples 💻
 0:00:43
How Compound Interest Makes You Rich
 0:00:59
Compound Interest
Комментарии