filmov
tv
GraphPad Prism Tutorial 1 - Introducing Table Types
Показать описание
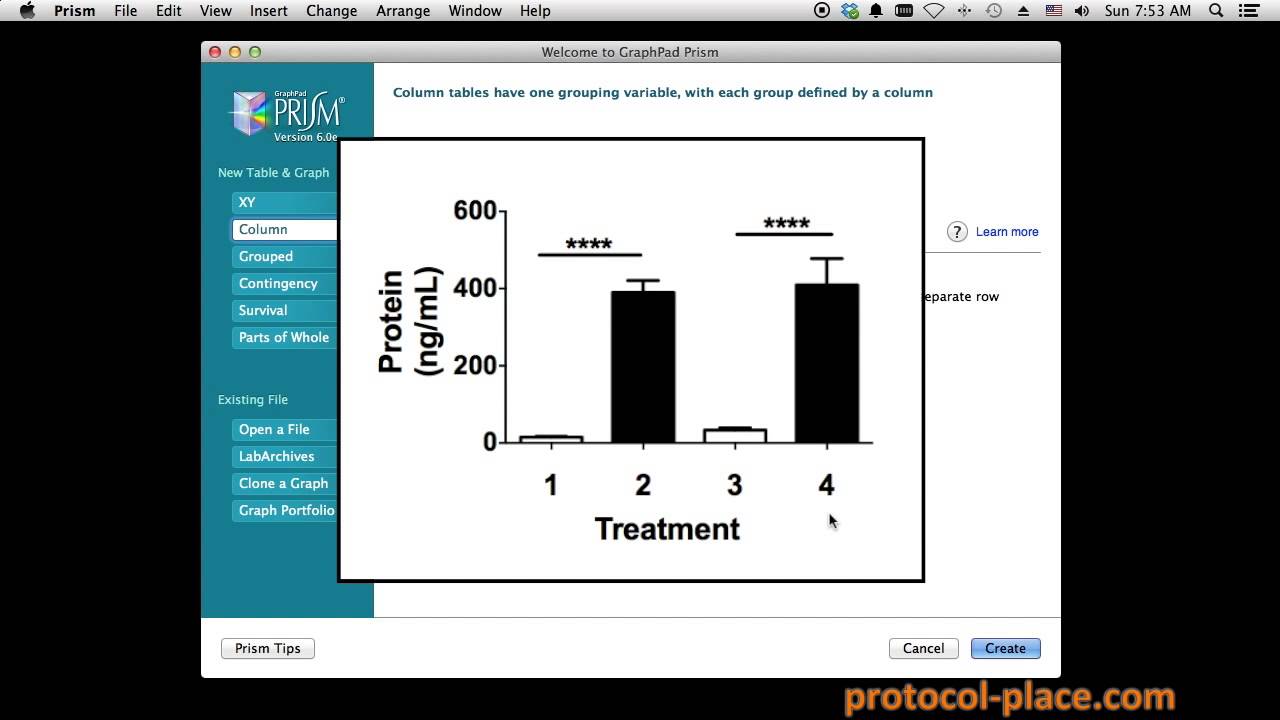
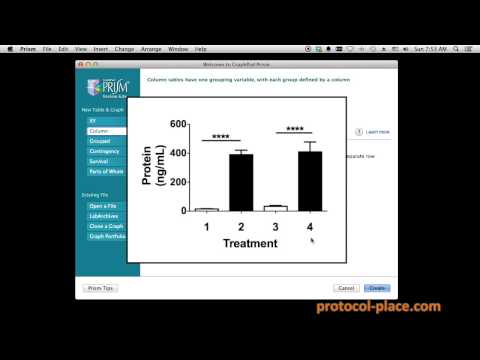
This is the first video in our series dedicated to the powerful data analysis software, GraphPad Prism. In this video, we introduce the six basic types of Data Tables that are used for various analyses in GraphPad Prism. Understanding how to choose the right type of Data Table will make all the subsequent steps for graphing and analyzing data very straightforward!
We hope you enjoy watching and benefit from our tutorials. If so, please take a minute to "like," or better yet, share them with others!
Thanks for watching!
Youssef Farhat
***Check out some of our other tutorials via the links below***
We hope you enjoy watching and benefit from our tutorials. If so, please take a minute to "like," or better yet, share them with others!
Thanks for watching!
Youssef Farhat
***Check out some of our other tutorials via the links below***
 0:08:08
GraphPad Prism Tutorial 1 - Introducing Table Types
 0:06:03
GraphPad Prism Tutorials E1 - Intro to GraphPad Prism (Part 1)
 0:15:14
Introduction to GraphPad Prism statistical tool | Detailed walk-through and step by step tutorial
 0:08:00
How To Analyze and Graph Your Data in Prism
 0:07:32
GraphPad prism tutorial #1 - Graphing Standard curve and interpolating unknowns
 0:13:05
Graphpad prism tutorial 1 ll how to create column graph ll Xgene and proteinX
 0:06:30
One way ANOVA #GraphPad #Prism
 0:16:32
GraphPad Prism Tutorial 2 - Making XY Graphs
 0:05:08
Tutorial 1 - GraphPad Basics
 0:06:43
GraphPad Prism-1 Introduction
 0:19:50
GraphPad Prism Tutorial [Deutsch]
 0:10:01
How to Download and Install GraphPad Prism | Learn statistical tool for research data analysis
 0:05:32
GraphPad Prism Tutorial - einfache Grafiken erstellen
 0:06:19
How to begin a new project in GraphPad Prism
 0:06:02
Grouped Bar Graph in GraphPad Software
 0:08:34
Graphpad prism quick tutorial ll Xgene and proteinX
 0:01:26
Data Entry in Prism
 0:11:46
How to add Significance Values in Bar Graph | Graphpad Prism | Statistics Bio7
 0:02:14
How to analyse data Normality using GraphPad Prism #normality #graphpad
 0:00:50
Import Data From Excel to Prism
 0:10:34
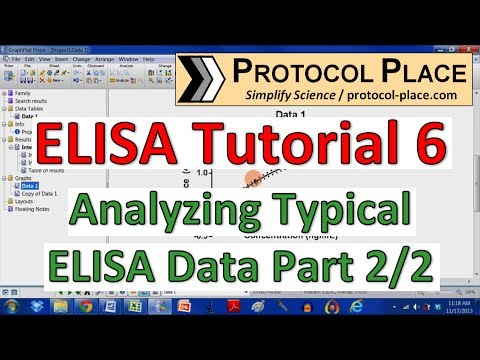
ELISA Tutorial 6: How to Analyze ELISA Data with GraphPad Prism
 0:14:54
Graphpad Prism Series (Part 1: Introduction to Software)
 0:05:08
GraphPad Tutorial 1 Russian
 0:08:31
When to use which statistical test | GraphPad Prism | Statistics for beginners | Biology lectures |
Комментарии