filmov
tv
Excel 2010 Statistics #33: SKEW function, Relationship between Mean Median & Mode and Skew

Показать описание
1. Learn about Skew
2. SKEW function
3. Relationship between Mean Median and Mode and Skew
This is for the Highline Community College Busn 210 Statistical Analysis for Business and Economics taught by Michael Girvin
 0:06:23
Excel 2010 Statistics #33: SKEW function, Relationship between Mean Median & Mode and Skew
 0:06:23
Excel 2010 Statistics 33 SKEW function Relationship between Mean Median Mode and Skew
 0:15:06
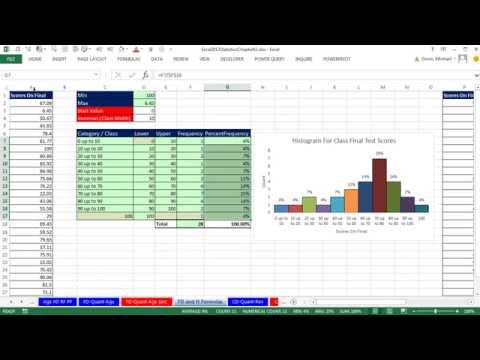
Excel 2010 Statistics #18: Frequency Distribution Shape & Histogram Skew & Sparklines
 0:02:54
Excel 2010 Statistics #34: Data Analysis Add-in Descriptive Statistics tool
 0:06:12
Excel 2010 Statistics #32: Detecting Outliers
 0:08:54
Excel 2010 tutorial Calculating Statistical Measures
 0:14:36
Use the SKEW Function and Comparing to Normal Distribution
 0:00:48
Excel SKEW P Function
 0:01:23
Excel SKEW Function
 0:01:01
EXCEL SKEW P
 0:41:36
Excel 2013 Statistical Analysis #8: Frequency Distributions, Histograms, Skew, Quantitative Variable
 0:00:50
How to Use the SKEW.P Function in Excel
 0:28:45
Excel Statistical Analysis 06: Frequency Distributions, Visualizations & Skew for Quantitative D...
 0:03:19
Basic Excel Business Analytics #20: Skew: Shape of Histogram, Shape of Quantitative Data
 0:12:33
Excel stats: skewness and kurtosis
 0:15:10
Excel Statistical Analysis 33: Chart Normal (Bell) Probability Distribution in Excel with Area Chart
 0:19:14
Testing the Normality (Skewness) of a Distribution Through MS Excel
 0:11:00
Skewness Definition Differences: Comparing Excel's Skew and Skew.P (also Mathematica and R)
 0:03:01
Create a Histogram (Bar Chart) using Microsoft Excel 2010
 0:09:03
Mean, Median, Range, Quartiles, Skewness
 0:03:45
BAN 401 - Module 2.2.3 - Mean Absolute Deviation, Skewness , Kurtosis in Excel
 0:01:21
Mastering Excel 2013 Lesson 39 Creating Charts And Graphs 33
 0:04:00
Check histograms for left and right skewness and the effect on the mean and median.
 0:06:55
How to Plot a Normal Distribution (Bell Curve) in Excel – with Shading!
Комментарии