filmov
tv
One Way ANOVA using Microsoft Excel

Показать описание
ANOVA :- ANALYSIS OF VARIANCE
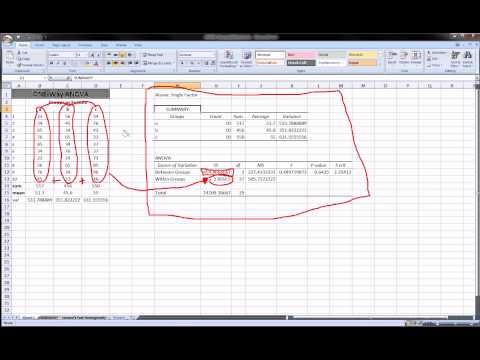
THIS VIDEO IS BASED ON COCEPT OF ONE WAY CLASSIFICATION OF ANOVA BY USING THE MICROSOFT EXCEL...(Test of the significance between the means of several Samples)
*REMEMBER*
If Calculated value of F statistics is greater than Critical value of F or if the P-Value is less than Significant level then we will Reject the Null Hypothesis.
F statistics value is calculated by dividing the Mean sum of squares of deviation Between the Samples By the Mean sum of Squares of deviation Within the Samples.
USE OF ANOVA
1- Test of the significance between the means of several Samples
2- Test of the significance between the Variance of two Samples
3- Study of homogenity in case of two-way classification
4- Test of Correlation and Regression
link for Part-2
Thanks For Watching :)
 0:08:31
 0:05:35
 0:01:00
 0:03:52
 0:06:22
 0:12:03
 0:07:15
 0:08:29
 0:09:53
 0:10:38
 0:13:46
 0:02:32
 0:06:50
 0:02:54
 0:06:08
 0:07:30
 0:02:14
 0:05:47
 0:00:16
 0:14:10
 0:05:11
 0:07:29
 0:16:30