filmov
tv
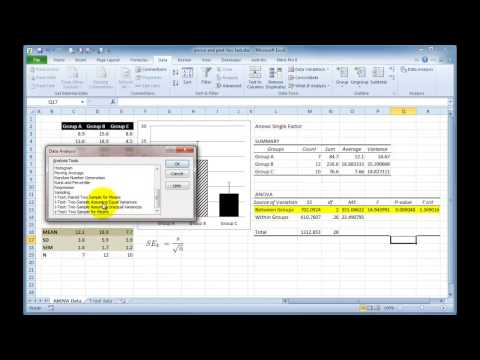
Performing a One-Way ANOVA in Excel: Step-by-Step Tutorial for Data Analysis

Показать описание
Learn how to perform a One-Way ANOVA using Microsoft Excel in this comprehensive tutorial. Perfect for those looking to analyze growth data or compare multiple treatment groups, this guide will walk you through the process of setting up your data, running the analysis, and interpreting the results. While Excel provides a quick and easy way to perform ANOVA, we also touch on when you might need to use more advanced statistical software like Minitab for deeper analysis.
In this video, you’ll discover:
How to prepare your data for a One-Way ANOVA in Excel
Step-by-step instructions for performing the analysis
How to interpret the results, including p-values and mean comparisons
When to consider using advanced tools like Minitab for further analysis
Outline:
Introduction to One-Way ANOVA: What it is and why it's useful for comparing group means.
Data Preparation: Organizing your data in Excel for proper analysis.
Running the ANOVA: Step-by-step walkthrough of the process in Excel.
Interpreting Results: Understanding p-values and what they tell you about your data.
Next Steps: When to use advanced statistical tools like Minitab for more detailed analysis.
Subscribe to our channel for more expert tutorials and training videos, and explore our website for comprehensive Green Belt and Black Belt certification programs.
#ExcelTutorial #OneWayANOVA #DataAnalysis #Statistics #ANOVAinExcel #LeanSixSigma #PyzdekInstitute
 0:08:31
 0:16:28
 0:14:14
 0:06:51
 0:10:54
 0:07:42
 0:06:08
 0:08:56
 0:05:35
 0:01:00
 0:10:50
 0:11:31
 0:11:20
 0:01:22
 0:13:45
 0:02:03
 0:13:29
 0:01:00
 0:09:43
 0:14:26
 0:03:52
 0:11:05
 0:00:38
 0:04:33