filmov
tv
Python Charting Stocks part 31 - Graphing live intra-day stock prices

Показать описание
This video teaches you how to take the live graphing tutorials and apply them to our charting tutorial here. The purpose of the videos in this series is to teach you how to program your own charting and analysis of stocks or Forex.
Looking for part 28 and 29? These are the intros to live charting, and here are the links:
This is beneficial for you if you plan to do any sort of algorithmic, high-frequency, or any sort of automated trading.
Looking for part 28 and 29? These are the intros to live charting, and here are the links:
This is beneficial for you if you plan to do any sort of algorithmic, high-frequency, or any sort of automated trading.
 0:13:48
Python Charting Stocks part 31 - Graphing live intra-day stock prices
 0:14:05
Charting Stocks part 30 - Graphing intra-day stock prices unix time stamps in Python
 0:03:53
How to Plot Candlestick Chart with 4 Lines of Code
 0:04:15
How to Chart Keltner Channels in Python and Matplotlib - Finance and Math Tutorials
 0:03:34
Backtesting the MACD strategy on 31 currency pairs using Python
 0:03:31
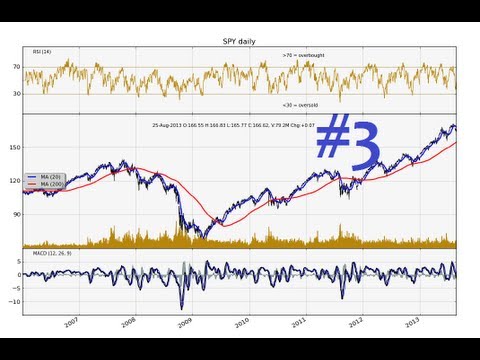
Part 3 - Visual Explanation (The Ultimate Trend Following Blueprint: Python-Based Trading Mastery)
 0:07:10
Python Charting Stocks/Forex for Technical Analysis Part 3 - Free intra-day stock data
 0:00:12
CRAZY $935,000 GAIN ON NVIDIA STOCK!!! WallStreetBets Options Trading NVDA AMC
 0:09:37
Charting Stocks/Forex for Technical Analysis Part 27 - Adding texts and Annotations to Matplotlib
 0:04:08
Charting Stocks in Python | Python for Trading | Quantra Free Course
 0:07:13
Stock charting program in Python
 0:06:05
Plotting Multiple Stock Market Indicators on One Graph - Five Minute Python Scripts
 0:06:11
Python: Graphing Bollinger Bands 3 Programming in Python, and Graphing in Matplotlib
 0:07:10
Charting Stocks and Forex Part 22 - How to calculate MACD in python
 0:04:11
Python Finance and Math Tutorials: Gopalakrishnan Range Index (GAPO)
 0:12:24
Plotting Live Stock Prices - II | Plotting Real Time Stock Prices Using Python
 0:08:01
Python Charting Stocks/Forex for Technical Analysis Part 9 - Adding Volume data to matplotlib graph
 0:06:10
Stock Charting in Python Updates
 0:05:22
Quick Stock Graph in Python, Beginner Tutorial
 0:08:33
How I Create Candlestick Chart for Technical Analysis with Python Part 2
 0:06:03
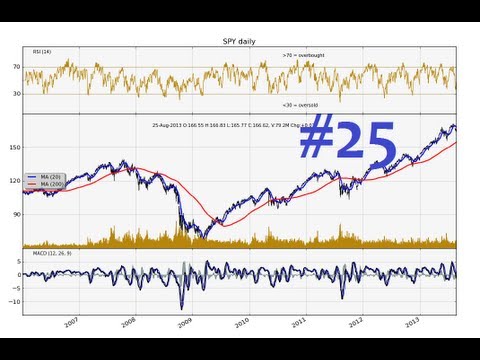
Charting Stocks Part 25 - Customizing RSI, candlestick, MACD, and Volume matplotlib chart
 0:00:15
Among Us in HD (Part 47) TIMBER #Shorts
 0:16:06
Python Charting Stocks/Forex for Technical Analysis Part 7 - Basic Financial Graph
 0:05:42
Python Charting Stocks/Forex for Technical Analysis Part 6 - Basic Financial Graph
Комментарии