filmov
tv
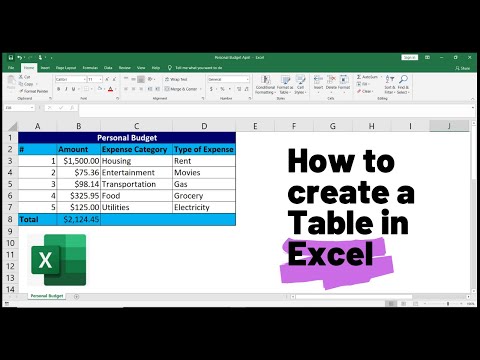
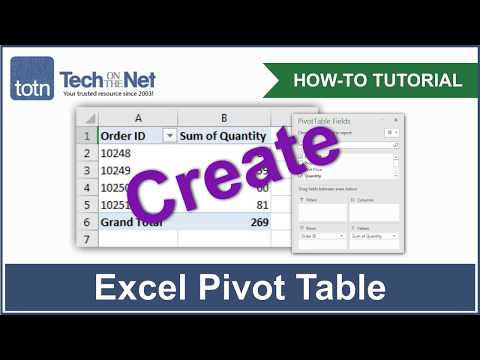
How to create a table from survey data in Excel | Questionnaires & pivot tables for beginners

Показать описание
1) You have raw data in an Excel sheet.
2) Click once anywhere inside the data.
3) Select the tab Insert and click the button Pivot table.
4) I recommend the option New worksheet.
5) Drag your most important variable into the Values box.
6a) You might have to change the type of value.
6b) Right-click on the value.
6c) If need be, drag down to Summarize Values By and change it.
7) Next, drag the same or another variable into another area (box).
***
If you do not see the Fields and boxes, click one inside the table.
***
One way to proceed is to remove the variables and start all over.
Another way is to click, drag, copy, and paste the table.
To keep the first table, you must remove the old variables.
***
Remember. The raw data are never altered. Pivot tables are non-intrusive.
All we are doing is experimenting. Analyzing.
***
The most important box is Values.
I start by dragging my main variable into that box.
In my video, I investigate the attitude to ice cream.
***
After dragging it to the Values box, I get some summary.
It shows the summary of all replies to that survey question.
However, we do not want the count of. We want the mean value.
Just right-click on the number.
Drag down to Summarize Values By, and select Average.
This is the mean value for all participants answering this survey question.
But it is just the beginning.
This is where Pivot tables shine.
I will now break it down by some other variable.
Let's take the Educational level.
Congratulation!
You have created a table from survey data.
***
I know that you think that the Pivot table function seems complicated.
But that is what everyone thinks. You are not alone.
Keep practicing!
Remember, Pivot tables do not alter the raw data.
It is just a tool. Analyzing data is fun!
You will become an extra valuable employee with your new Excel skills.
***
There is no right or wrong here.
It is all about testing, exploring, and solving problems.
***
Copyright
Text, video, and audio © Kent Löfgren, Sweden
 0:03:42
How to Create a Table in Excel (Spreadsheet Basics)
 0:05:18
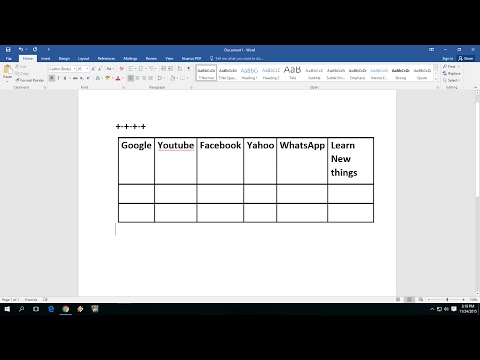
How to Create a table in Microsoft Word
 0:06:24
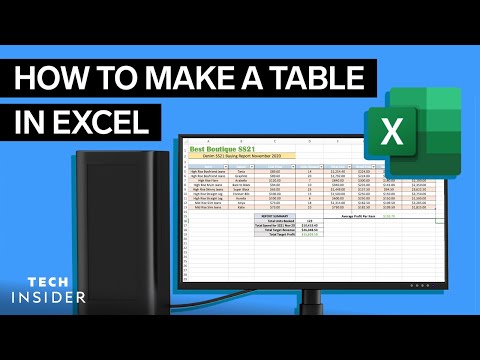
How to Make a Table in Excel (Format as Table)
 0:01:29
Easiest way to Insert/Create Table in MS Word 2016
 0:00:48
How to Create a Table in Excel
 0:01:37
How To Make A Table In Excel
 0:00:19
How to create a table in Excel | Shortcut to create table
 0:03:17
How to Insert Table In Microsoft Word
 0:00:25
Master Tables in MS Word: Tips for Effortless Adding & Formatting #EfficientTables #TableDesign
 0:20:49
How to Create Pivot Table in Excel
 0:06:06
Access 2016 - Creating Tables - How To Create a New Table in Microsoft MS Design & Datasheet Vie...
 0:00:34
How to make a Pivot Table in 3 Steps‼️ #excel
 0:00:26
How To Create Table In Ms Word | Short Method To Insert Table| #short #word #exceltutorial
 0:08:10
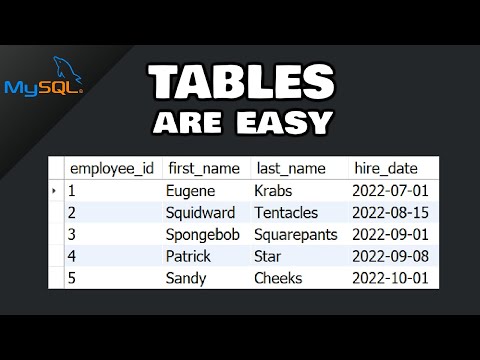
MySQL: How to create a TABLE
 0:11:54
How to create a spreadsheet in excel in 5 minutes | excel for beginners
 0:02:27
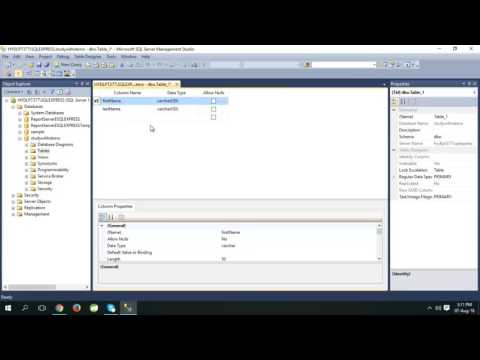
How to Create Table in SQL Server Management Studio
 0:00:29
How To Create An Excel Table
 0:04:42
How to Create Table in MS Access| Microsoft Access 2016 Tutorial [Hindi/Urdu]
 0:10:01
25: Table In HTML and CSS | How To Create Tables | Learn HTML and CSS | HTML Tutorial | CSS Tutorial
 0:00:22
Create table in canva #canva #canvatutorial #canvatutorials
 0:00:44
Excel Quick Tips - How to create a data table using keyboard shortcuts
 0:00:55
How to Create a Pivot Table in Excel
 0:02:15
How to create a Pivot Table in Excel
 0:00:21
How do you create a table in HTML?To create table in HTML,
Комментарии