filmov
tv
Support Vector Machines (SVMs): A friendly introduction

Показать описание
For a code implementation, check out this repo:
40% discount code: serranoyt
An introduction to support vector machines (SVMs) that requires very little math (no calculus or linear algebra), only a visual mind.
This is the third of a series of three videos.
0:00 Introduction
1:42 Classification goal: split data
3:14 Perceptron algorithm
6:00 Split data - separate lines
7:05 How to separate lines?
12:01 Expanding rate
18:19 Perceptron Error
19:26 SVM Classification Error
20:34 Margin Error
25:13 Challenge - Gradient Descent
27:25 Which line is better?
28:24 The C parameter
30:16 Series of 3 videos
30:30 Thank you!
 0:02:19
Support Vector Machine (SVM) in 2 minutes
 0:20:32
Support Vector Machines Part 1 (of 3): Main Ideas!!!
 0:03:18
The Kernel Trick in Support Vector Machine (SVM)
 0:12:50
Support Vector Machine (SVM) Basic Intuition- Part 1| Machine Learning
 0:07:28
Support Vector Machine (SVM) in 7 minutes - Fun Machine Learning
 0:09:34
How Support Vector Machine (SVM) Works Types of SVM Linear SVM Non-Linear SVM ML DL by Mahesh Huddar
 0:28:44
Support Vector Machines (SVM) - the basics | simply explained
 0:07:48
Support Vector Machine (SVM) Part-1 ll Machine Learning Course Explained in Hindi
 0:10:19
Feature Scaling with Standard Scaler: Step-by-Step Guide for Machine Learning in Python
 0:26:43
Support Vector Machine - How Support Vector Machine Works | SVM In Machine Learning | Simplilearn
 0:30:58
Support Vector Machines (SVMs): A friendly introduction
 0:23:22
Machine Learning Tutorial Python - 10 Support Vector Machine (SVM)
 0:11:21
Support Vector Machines - THE MATH YOU SHOULD KNOW
 0:49:34
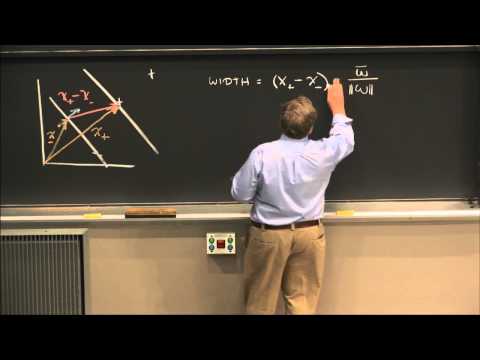
16. Learning: Support Vector Machines
 0:23:06
SVM (Support Vector Machine) - Algoritmos de Aprendizado de Máquinas
 0:08:07
Support Vector Machines : Data Science Concepts
 0:04:12
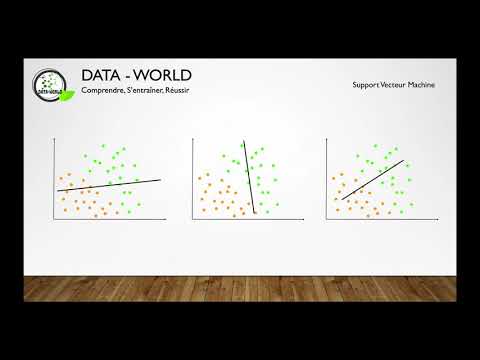
Comprendre le Machine Learning: Les SVM
 0:44:49
Support Vector Machines in Python from Start to Finish.
 0:11:16
When should I use Support Vector Machines (SVM)?
 0:07:15
Support Vector Machines Part 2: The Polynomial Kernel (Part 2 of 3)
 0:10:19
SVM (The Math) : Data Science Concepts
 0:50:30
Support Vector Machine - SVM - Classification Implementation for Beginners (using python) - Detailed
 0:06:09
What are the pros and cons of Support Vector Machine (SVM) algorithm?
 0:09:57
Solved Support Vector Machine | Linear SVM Example by Mahesh Huddar
Комментарии