filmov
tv
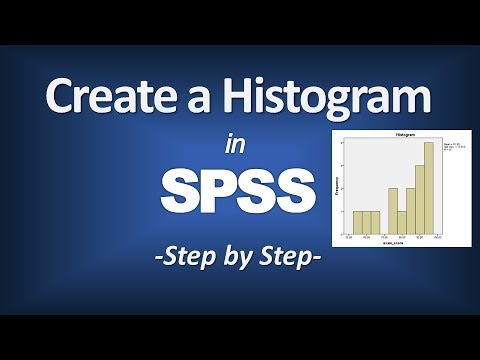
IBM SPSS Statistics 20: Histograms

Показать описание
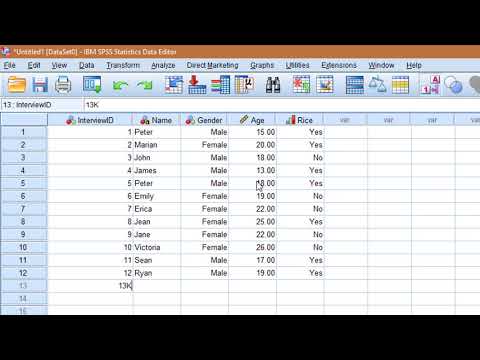
Histograms are graphical representations of data similar to a bar chart. The difference between the two is that bar charts measure categorical variables while histograms measure quantitative variables. This video shows users how to create a histogram in SPSS.
#myCalStateLA #mycsula #its #CalStateLA #spss #ibmspss
#myCalStateLA #mycsula #its #CalStateLA #spss #ibmspss
 0:02:07
 0:11:01
 0:09:45
 0:01:05
 0:02:16
 0:05:14
 0:04:10
 0:02:29
 0:02:45
 0:03:56
 0:15:15
 0:00:45
 0:02:25
 0:11:37
 0:01:17
 0:01:21
 0:04:46
 0:03:24
 0:03:57
 0:02:21
 0:01:52
 0:04:35
 0:08:11
 0:04:13