filmov
tv
Types Of Charts - Technical Series | Edelweiss Wealth Management

Показать описание
In this interesting video of technical Series, the Edelweiss team talks about important Technical charts.
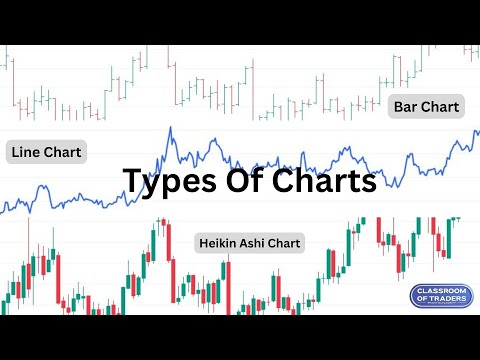
1. Line Chart: These are the most basic form of charts which comprises of a single line from left to right, which links to the closing prices for a given time. A line chart help traders to spot trends in the price movements.
2. Bar Chart: They are also called open high/low close, i.e. OHLC charts. They are a cluster of vertical lines that indicates the price range during the given time. The top part and lower part of the vertical line represents the highest price and lowest price at which the stock had traded during the day. The horizontal line on the left represents the price at which the stock opened, while the closing price is located on the right side of the line.
3. Candlestick Chart:
The main component of this chart is in a shape of a thick body with a line extending above and below the body. The line above the body is called the upper shadow or wick and the line below the body is called lower shadow or wick. The top of the upper shadow represents the highest price while the bottom of the lower shadow depicts the lowest price in that time. Candlestick charts can offer this information for a much larger time. Patterns are formed both by the real body and the shadows. The trader must observe their previous candlesticks and analyze how they have changed over time. Candlestick charts can offer great insights into the market sentiment.
While every chart has its usage, it mainly depends on the type of investor you are and strategies you prefer to use while investing.
Connect with us
 0:05:24
Types of Charts Used in Technical Analysis
 0:07:29
3. Types of charts
 0:03:02
Types Of Charts - Technical Series | Edelweiss Wealth Management
 0:10:53
How To Read Stock Charts For Beginners
 0:55:18
How to Read Candlestick Charts (with ZERO experience)
 0:16:29
4 Types of Technical Charts New Traders Need To Know
 0:03:36
Types Of Charts | Types of Technical Analysis | 4 Types of Chart Analysis used in Technical Analysis
 0:12:08
Which is the best chart: Selecting among 14 types of charts Part I
 0:20:14
How to learn chart analysis in stock market for Trading
 1:24:55
Basics of Technical Analysis : Types of Charts
 0:08:10
2. What are different types of charts - Technical Analysis
 0:01:00
Candlestick Charts: Explained in 60 Seconds!
 0:13:30
How To Read Candlestick Charts FAST (Beginner's Guide)
 0:24:31
Excel Charts and Graphs Tutorial
 0:08:10
Which is the best chart: Selecting among 14 types of charts Part II
 0:10:34
Types Of Charts In Stock Market
 0:04:46
Different Types of Technical Charts: A Beginner's Guide | Motilal Oswal
 0:48:29
What is Candlestick Charts for Trading? Intraday Technical Analysis Basics Explained E23
 0:01:54
Types of Charts in Technical Analysis | Technical Analysis of Stocks | IIFL Securities
 0:09:15
How To BEST Read Cryptocurrency Charts
 0:03:43
How to talk about charts and graphs in English (advanced English lessons)
 0:13:27
How To Read Stock Charts Without Getting Confused?
 0:13:45
Types of Charts in Stock Market | Important Chart Types | Explained in Hindi
 0:03:21
Types Of Charts | Types of Technical Analysis | 4 Types of Chart Analysis used in Technical Analysis
Комментарии