filmov
tv
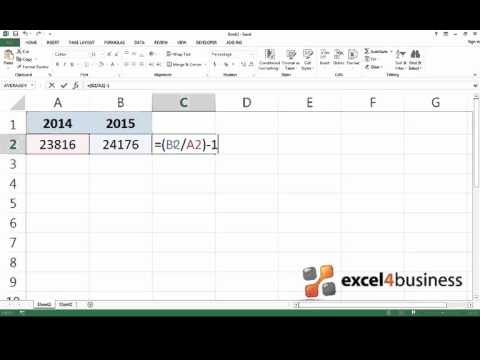
How to create a 'Percent Of Total' calculated field without using table calculations in Tableau

Показать описание
In this silent video, you'll learn how to create a view that shows the percent of total, without using table calculations. For example: when using table calculations in views that contain grand or subtotals, the grand/subtotals may show unexpected results with a table calculation in use.
- - - - - - - - - - - - - -
Step 1
1. Instead of table calculations, or using the TOTAL() function, use Level of Detail (LOD) expressions.
2. For example, using Superstore sample data, to show what percent of total each Segment is per Region:
Select Analysis and then Create Calculated Field. Name the calculation Percent of Total, enter the following calculation, and click OK:
{ FIXED [Segment], [Region] : SUM([Sales]) }/{ FIXED [Region] : SUM([Sales]) }
Step 2
1. Right-click Percent of Total in the Measures pane and select Default Properties ; Number Format... ; Percentage
2. Place Percent of Total on Columns.
3. Place Region on Rows.
4. Place Segment on Color.
5. Place Percent of Total on Label.
Related solutions:
- - - - - - - - - - - - - -
- - - - - - - - - - - - - -
Step 1
1. Instead of table calculations, or using the TOTAL() function, use Level of Detail (LOD) expressions.
2. For example, using Superstore sample data, to show what percent of total each Segment is per Region:
Select Analysis and then Create Calculated Field. Name the calculation Percent of Total, enter the following calculation, and click OK:
{ FIXED [Segment], [Region] : SUM([Sales]) }/{ FIXED [Region] : SUM([Sales]) }
Step 2
1. Right-click Percent of Total in the Measures pane and select Default Properties ; Number Format... ; Percentage
2. Place Percent of Total on Columns.
3. Place Region on Rows.
4. Place Segment on Color.
5. Place Percent of Total on Label.
Related solutions:
- - - - - - - - - - - - - -
 0:02:43
 0:01:09
 0:00:42
 0:00:56
 0:01:51
 0:02:06
 0:01:08
 0:01:16
 0:04:29
 0:07:03
 0:01:19
![[SALESFORCE] - How](https://i.ytimg.com/vi/3myFMFf7EOc/hqdefault.jpg) 0:02:41
0:02:41
 0:00:14
 0:02:24
 0:09:48
 0:03:10
 0:09:06
 0:02:05
 0:00:34
 0:03:25
 0:10:02
 0:04:12
 0:08:51
 0:05:07