filmov
tv
The Sankey Diagram - GCSE Physics

Показать описание
In this video I explain all about the Sankey Diagram and what you'll need to know for GCSE Physics.
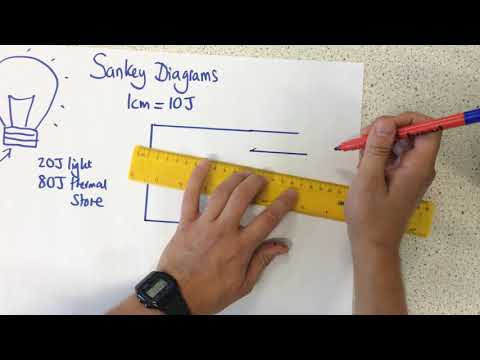
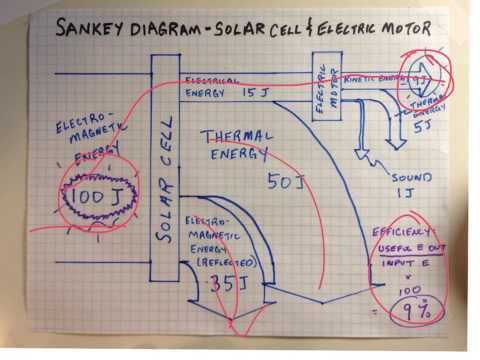
The Sankey Diagram is a type of diagram that shows how energy is transferred. The width of each arrow is proportional to the amount of energy being transferred i.e. a wider arrow shows a greater amount of energy transfer.
Thanks for watching,
Lewis
Relevant for GCSE Physics 9-1 in the following exam boards:
OCR B
WJEC
Edexcel International IGCSE
_____________________________________
MY PHYSICS WEBSITES
Find even more videos organised by exam board and topic at:
GCSE Physics Online
A Level Physics Online
MY YOUTUBE CHANNEL
Your support in watching this video has been invaluable! To contribute towards the free videos on YouTube, make a small donation at:
FOLLOW ME
#energy #gcsephysics #physicsonline
 0:01:37
The Sankey Diagram - GCSE Physics
 0:03:37
Physics - Energy - Sankey Diagrams
 0:04:25
The 5 steps to drawing a perfect Sankey diagram
 0:02:24
Energy, Sankey Diagrams, Efficiency | GCSE Physics
 0:04:10
Sankey Diagrams - p159 (Foundation p160)
 0:05:08
GCSE Physics - Efficiency #8
 0:06:16
Sankey Diagrams - IB Physics
 0:01:29
An Introduction to Sankey diagrams.
 0:03:44
Sankey Diagrams and Effciency
 0:08:04
What is a SANKEY diagram (+ examples) ??
 0:01:29
How to draw sankey diagrams gcse physics?
 0:01:20
What is a Sankey Diagram
 0:04:06
Sankey Diagrams (Year 7)
 0:05:46
Year 10 Physics Lesson 2 Sankey diagrams and efficiency
 0:08:09
Energy Transfer Sankey Diagrams
 0:17:52
recap, efficiency and sankey diagrams (GCSE Physics, energy)
 0:09:30
How to make a Sankey Diagram
 0:07:10
Sankey Diagrams
 0:01:20
Drawing of Sankey Diagram
 0:02:58
Physics! Efficiency! Sankey Diagrams!
 0:08:50
mr i explains: How to draw a Sankey Diagram to represent energy transfers
 0:09:55
IB Physics SL revision - EPCC 1 - sankey diagrams plus 2 - energy
 0:03:16
sankey diagram
 0:05:13
Sankey Diagrams with Amber Thomas (Ep. 12)
Комментарии