filmov
tv
Sankey Diagrams - IB Physics

Показать описание
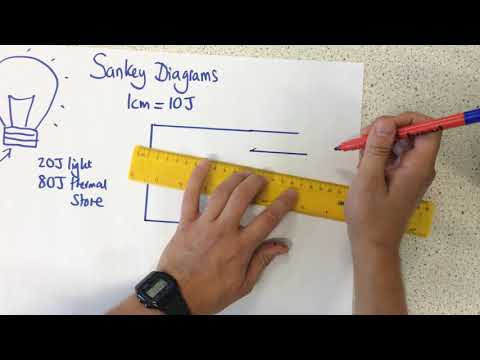
Sankey Diagrams are charts that show how energy is moving through a system, how much energy goes into a system, how much useful energy we get out of the system, and how much energy is "lost" as useless energy by the system. This video explains the steps to drawing a Sankey diagram with a few example problems.
0:00 Definition of Sankey Diagrams
0:42 Step 1
1:00 Step 2
1:39 Step 3
2:32 Step 4
3:24 Example of all 4 Steps
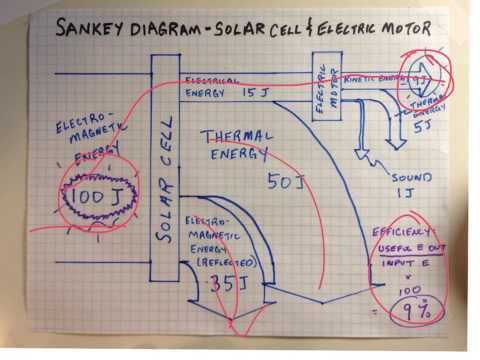
4:19 Complex Sankey Diagrams
6:17 How Sankey Diagrams are Used
6:37 Efficiency in Sankey Diagrams
0:00 Definition of Sankey Diagrams
0:42 Step 1
1:00 Step 2
1:39 Step 3
2:32 Step 4
3:24 Example of all 4 Steps
4:19 Complex Sankey Diagrams
6:17 How Sankey Diagrams are Used
6:37 Efficiency in Sankey Diagrams
 0:06:16
Sankey Diagrams - IB Physics
 0:04:01
Sankey diagrams and energy density [IB Physics SL/HL]
 0:03:37
Physics - Energy - Sankey Diagrams
 0:07:59
Sankey Diagrams IB Physics
 0:02:36
Sankey diagrams and energy density [IB Physics SL/HL]
 0:09:55
IB Physics SL revision - EPCC 1 - sankey diagrams plus 2 - energy
 0:16:26
Sankey Diagrams
 0:11:11
Fossil Fuel, Sankey Diagram, Efficiency - IB Physics A.3 (Part 9)
 0:04:25
The 5 steps to drawing a perfect Sankey diagram
 0:04:10
Sankey Diagrams - p159 (Foundation p160)
 0:02:21
8-1 Sankey Diagrams and Power Plants
 0:02:33
8.1.2 – Sankey Diagrams
 0:01:37
The Sankey Diagram - GCSE Physics
 0:01:29
An Introduction to Sankey diagrams.
 0:22:50
8.1.1 Energy Sources, Fossil Fuels, and Sankey Diagrams (1-15)
 0:21:56
IB2 - Sankey Diagrams and Fossil Fuels
 0:06:07
Sankey diagrams. Science made easy.
 0:05:18
8PS02 Sankey Diagrams
 0:03:35
Sankey DIagrams and Energy HD
 0:08:50
mr i explains: How to draw a Sankey Diagram to represent energy transfers
 0:11:52
Sankey Diagrams
 0:13:19
How to draw Sankey Diagram with and without Grid
 0:01:41
The Sankey diagram represents the energy flow for a coal-fired power station. What is the overall
 0:09:30
How to make a Sankey Diagram
Комментарии