filmov
tv
Distance - Time Graphs - Speed and Acceleration on a Graph

Показать описание
In the video, I show several distance-time graphs and explain the motion that the graphs represent.
I show what a graph of constant motion looks like, what reverse looks like on a graph, and what acceleration and deceleration look like.
The slope of a distance-time graph represents the velocity of the object. A positive slope indicates that the object is moving in a positive direction, while a negative slope indicates that the object is moving in a negative direction. The steeper the slope, the faster the object is moving.
The y-intercept of a distance-time graph represents the initial position of the object. The x-intercept of a distance-time graph represents the time at which the object reaches its final position.
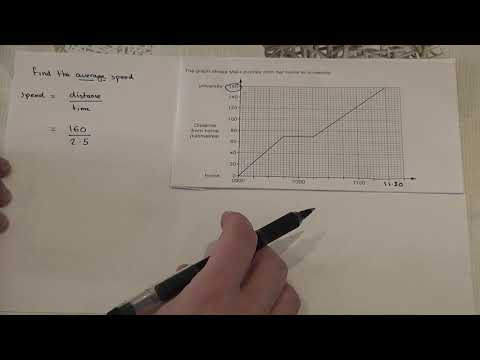
Distance-time graphs can be used to analyze the motion of objects. For example, they can be used to determine the velocity of an object, the acceleration of an object, and the distance traveled by an object.
I show what a graph of constant motion looks like, what reverse looks like on a graph, and what acceleration and deceleration look like.
The slope of a distance-time graph represents the velocity of the object. A positive slope indicates that the object is moving in a positive direction, while a negative slope indicates that the object is moving in a negative direction. The steeper the slope, the faster the object is moving.
The y-intercept of a distance-time graph represents the initial position of the object. The x-intercept of a distance-time graph represents the time at which the object reaches its final position.
Distance-time graphs can be used to analyze the motion of objects. For example, they can be used to determine the velocity of an object, the acceleration of an object, and the distance traveled by an object.
 0:04:01
GCSE Physics - Distance-Time Graphs #53
 0:03:39
Distance Time Graphs | Geometry | Maths | FuseSchool
 0:03:05
Distance-time graphs & speed - GCSE Science Shorts Sketch
 0:01:01
Distance Time Graph [Explained with 3D Animated Video] | Alyss
 0:03:26
Plotting Your Distance-Time Graph
 0:05:00
Finding Speed from Distance-Time Graph
 0:08:30
The Maths Prof: Distance-Time Graphs (part 1)
 0:02:12
Distance time graphs and average speed (Essential GCSE revision)
 0:08:32
Motion Distance Time Graphs | Graphical Representation of Motion Class 9 NCERT | #physics #study
 0:04:07
Distance Time Graphs
 0:14:04
Real Life and Distance Time Graphs
 0:03:34
Distance-Time Graphs - GCSE Physics
 0:25:29
Distance-Time Graphs (Travel Graphs) | Grade 5+ Crossover | GCSE Maths Tutor
 0:01:57
Distance-Time and Velocity-Time Graphs | GCSE Physics | Doodle Science
 0:04:16
Drawing Distance Time Graphs
 0:01:00
Distance-Time Graphs and Velocity-Time Graphs in 99 seconds #GCSE #Physics #Revision
 0:03:26
Distance-time Graph for IGCSE Physics, GCE O level Physics
 0:05:10
GCSE Physics - Velocity Time Graphs #54
 0:08:08
Distance (position) to Velocity Time Graph Physics Help
 0:18:38
Speed Time Graphs - GCSE Higher Maths
 0:07:48
Drawing Distance Time Graphs
 0:05:40
Distance Time Graph - Calculating Speed
 0:07:57
Speed time graph (Acceleration and Total distance)
 0:06:24
Distance Time Graph Calculations
Комментарии