filmov
tv
Distance-Time Graphs - GCSE Physics

Показать описание
This video introduces distance-time graphs. These graphs show how the distance an object has moved varies with time.
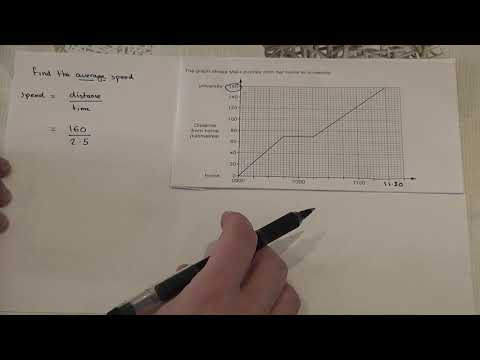
On the x-axis we have time and on the y-axis we have distance. The gradient of a distance-time graph gives the speed of an object. This is because the gradient is given by the change in the y-axis (distance) divided by the change in the x-axis (time). This means that the gradient is the change in distance divided by the change in time i.e. speed.
A steeper gradient means that an object is travelling at a greater speed.
Thanks for watching,
Lewis
Relevant for GCSE Physics 9-1 in the following exam boards:
AQA (including Trilogy)
Edexcel
CCEA
OCR A
OCR B
WJEC
CIE (Cambridge International Examinations) IGCSE
Edexcel International IGCSE
_____________________________________
MY PHYSICS WEBSITES
Find even more videos organised by exam board and topic at:
GCSE Physics Online
A Level Physics Online
MY YOUTUBE CHANNEL
Your support in watching this video has been invaluable! To contribute towards the free videos on YouTube, make a small donation at:
FOLLOW ME
#distancetimegraphs #gcsephysics #physicsonline
 0:04:01
GCSE Physics - Distance-Time Graphs #53
 0:03:34
Distance-Time Graphs - GCSE Physics
 0:03:05
Distance-time graphs & speed - GCSE Science Shorts Sketch
 0:03:26
Distance-time Graph for IGCSE Physics, GCE O level Physics
 0:03:39
Distance Time Graphs | Geometry | Maths | FuseSchool
 0:01:57
Distance-Time and Velocity-Time Graphs | GCSE Physics | Doodle Science
 0:04:33
Distance-Time Graphs and Speed - GCSE Physics Revision
 0:03:26
Plotting Your Distance-Time Graph
 0:05:10
GCSE Physics - Velocity Time Graphs #54
 0:11:15
Distance-time graphs - IGCSE Physics
 0:01:00
Distance-Time Graphs and Velocity-Time Graphs in 99 seconds #GCSE #Physics #Revision
 0:13:55
Basic Physics - Lesson 2: Distance-time graphs (GCSE Science)
 0:01:01
Distance Time Graph [Explained with 3D Animated Video] | Alyss
 0:02:12
Distance time graphs and average speed (Essential GCSE revision)
 0:04:18
Distance-Time Graphs - GCSE Physics Worksheet Answers EXPLAINED
 0:04:07
Distance Time Graphs
 0:05:11
Motion Graphs
 0:02:07
Distance Time Graphs - GCSE Physics
 0:31:01
Velocity Time Graphs, Acceleration & Position Time Graphs - Physics
 0:00:16
distance time graph
 0:04:01
Distance-Time and Speed-Time Graphs - A Level Physics
 0:06:44
Calculating Distance From Velocity-Time Graph - GCSE Physics | kayscience.com
 0:10:31
IGCSE Physics - Understanding Distance Time Graph
 0:05:59
GCSE Physics - The difference between Speed and Velocity & Distance and Displacement #51
Комментарии