filmov
tv
Mild introduction to Structural Equation Modeling (SEM) using R

Показать описание
Description:
When working with data, we often want to create models to predict future events, but we also want an even deeper understanding of how our data is causally connected or structured. In this workshop, we explored the connectedness of data using structural equation modeling (SEM) with the {lavaan} package.
The packages used in this video is lavaan, semPlot, MPsychoR and corrplot. We recommend that you have these packages installed prior to the starting if you want to follow activly. Below is a line of code you can use.
The speaker, Ronny Scherer, received his PhD from Humboldt-Universität zu Berlin in 2012, and is currently working at the Centre for Educational Measurement, University of Oslo (CEMO). His research and teaching cover structural equation modeling, meta-analysis, computer-based assessments, and multilevel analysis. Ronny is coordinating the Measurement Models course at CEMO.
Slides and code used in the video can be found here:
Slides:
Code:
Timestamps:
0:00:00 Start
0:00:39 Welcome and introduction to the workshop
0:05:57 Structural equation modeling—Why? Definition and advantages
0:14:45 Structural equation modeling—What? Examples from different disciplines
0:22:45 Structural equation modeling—How? Steps taken in SEM
0:35:54 Illustrative example—Model 1: Linear regression
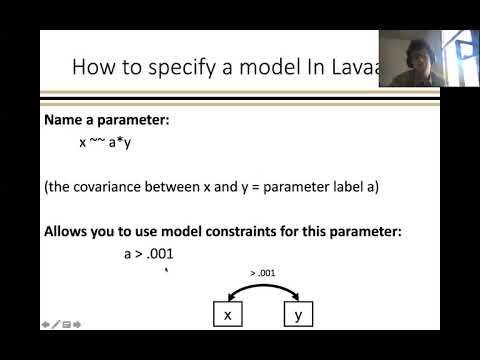
0:41:48 Implementation of Model 1 in lavaan
1:09:53 Testing the equality of (unstandardized) regression parameters in Model 1
1:16:26 Illustrative example—Model 2: Mediation model
1:20:00 Implementation of Model 2 in lavaan
1:30:07 Illustrative example—Model 3: Confirmatory factor analysis
1:34:58 Implementation of Model 3 in lavaan
1:48:54 Illustrative example—Model 3b: Confirmatory factor analysis modified
1:51:28 Implementation of Model 3b in lavaan and model comparison
2:04:33 Illustrative example—Model 4: Structural equation model
2:05:58 Implementation of Model 4 in lavaan
2:19:15 Illustrative example—Model 5: Multi-group structural equation model
2:21:00 Data issues in SEM—What if’s and possible solutions
 2:30:30
Mild introduction to Structural Equation Modeling (SEM) using R
 0:04:42
SEM (1): What is Structural Equation Modelling and when to use it?
 0:32:40
A Gentle Introduction to Structural Equation Modelling
 2:42:36
Introduction to Structural Equation Modeling
 0:10:13
A Quick Overview of Structural Equation Modeling
 0:05:49
How to perform Structural Equation Modeling (SEM) in R
 0:11:35
Lavaan syntax and SEM introduction
 2:33:06
IE311 - Week 2. Introduction to Structural Equation Modeling
 0:14:55
Introduction to Structural Equation Modeling (SEM) with Levi Littvay
 0:05:11
Understanding Structural Equation Modelling with everyday constructs
 0:07:03
Three main types of structural equation models
 1:01:56
Structural Equation Modeling for Corpus Linguistic Data | Part 2 – Tove Larsson and Gregory Hancock...
 1:02:04
UMB U54 RDAC Seminar Pt.3 Intro to Structural Equation Modeling with R – Daniel Gundersen, PhD
 0:48:31
Introduction to Structural Equation Modeling
 1:32:42
Structural Equation Modeling: An Introduction
 0:12:33
Basic Concepts Related to Structural Equation Modeling (Lecture 2) | www.pietutors.com
 0:33:10
Structural Equation Modelling: A Step by Step Guide
 0:31:10
SEM 2 (2020) - Lecture 2-3: Structural Equation Modeling
 0:03:40
Structural Equation Modeling (SEM)
 1:39:53
Introduction to Structural Equation Modelling
 0:51:11
Testing full structural equation model using Lavaan (see linked text file under video description)
 5:49:14
Structural Equation Modelling Workshop - Day 1
 0:06:19
Structural Equation Modelling in plain language for research
 0:18:46
Full Structural Equation Modeling Lecture
Комментарии