filmov
tv
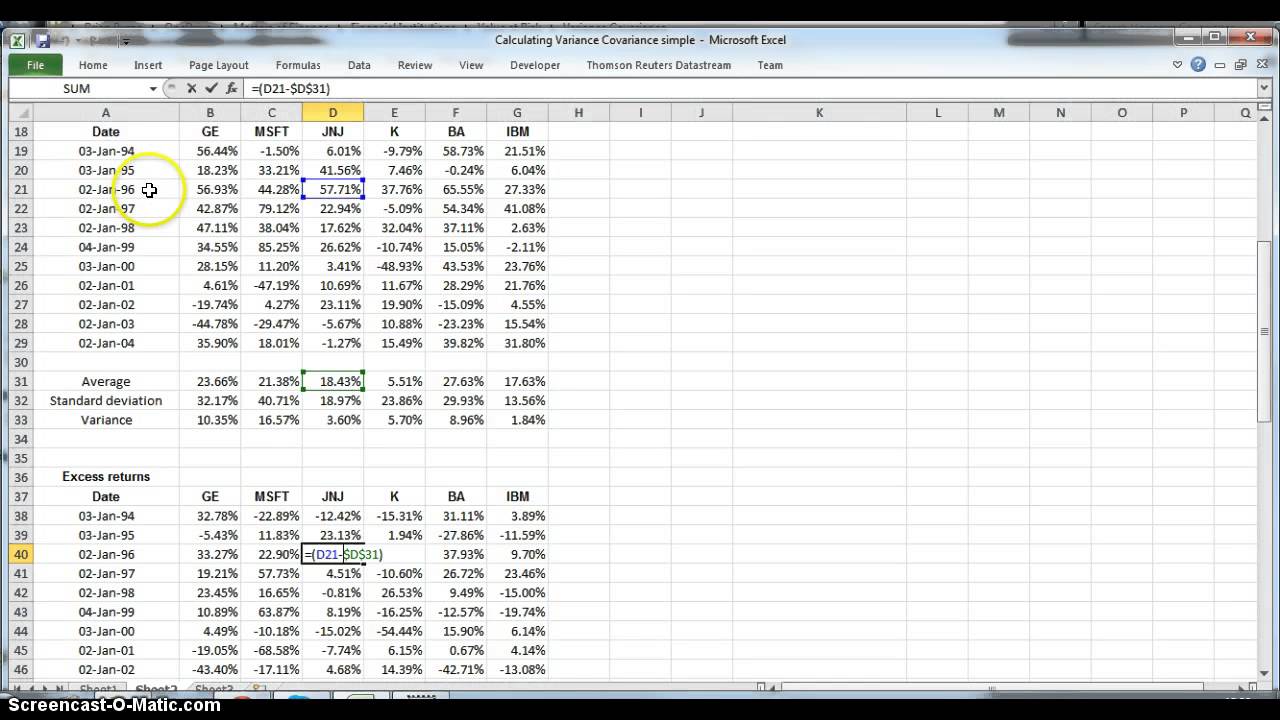
Calculating the Variance Covariance Matrix using stock Prices
Показать описание
Modeling - I take 12 years of annual data for 6 stocks and work out the variance covariance matrix.
Simon Benninga comprehensively develops Excel spreadsheets to explain advanced topics in finance. His approach is intuitive and simple yet succinct in explaining otherwise complex areas.
The Variance-Covariance Matrix: Cornerstone of Portfolio Analysis
In the realm of investment management, the variance-covariance matrix stands as a pivotal tool, providing deep insights into the dynamics of asset returns within a portfolio. This matrix is not just a mathematical construct but a practical guide to understanding and managing risk and return in a portfolio.
1. Understanding the Basics:
Variance: At its core, the variance measures the spread of a security's returns around its mean. It's a quantification of risk. For a portfolio, understanding each asset's variance is key to assessing its inherent risk.
Covariance: While variance focuses on individual assets, covariance deals with how pairs of securities move in relation to each other. Positive covariance indicates that assets tend to move in the same direction, whereas negative covariance suggests they move in opposite directions.
2. Building the Matrix:
The variance-covariance matrix is a symmetrical matrix where each element represents the covariance between a pair of assets. The diagonal elements are variances of individual assets, while off-diagonal elements are covariances.
3. Application in Portfolio Analysis:
Risk Assessment: By analyzing this matrix, investors can understand the combined risk of the portfolio, not just the risk of individual assets.
Diversification: A key strategy in portfolio management is diversification, which aims to reduce risk without sacrificing returns. The variance-covariance matrix helps in identifying assets that, when combined, reduce the overall portfolio risk due to diversification benefits.
 0:04:42
Covariance (10 of 17) Covariance Matrix with 3 Data Sets (Part 1)
 0:05:10
How to create a Variance Covariance Matrix in Excel
 0:11:00
The Covariance Matrix : Data Science Basics
 0:07:33
Calculating the Variance Covariance Matrix using stock Prices
 0:05:13
Variance-covariance matrix using matrix notation of factor analysis
 0:08:34
Calculating the Variance Covariance Matrix of stock Returns in Python
 0:05:10
Using the Variance Covariance matrix to calculate the Value at Risk cutoff points
 0:05:07
CompX: Mathematics of PCA - Covariance matrices
 1:54:26
Week-1|Problem solving
 0:11:27
calculating variance covariance matrix by different methods using live data in excel
 0:13:57
The covariance matrix
 0:22:23
Covariance, Clearly Explained!!!
 0:07:47
Covariance Clearly Explained!
 0:04:31
Variance Covariance Matrix in Excel
 0:19:46
Portfolio variance-covariance matrix, return, and standard deviation for 3 securities on Excel.
 0:03:00
9 Estimating the covariance matrix
 0:07:18
How to Easily Calculate Portfolio Variance for Multiple Securities in Excel
 0:14:24
Calculating Portfolio Variance using Variance Covariance Matrix in Excel + Risk Contribution
 0:22:24
Value-at-risk (VaR) - variance-covariance and historical simulation methods (Excel) (SUB)
 0:00:59
Calculating covariance matrix using Excel
 0:07:25
Special Topics - The Kalman Filter (19 of 55) What is a Variance-Covariance Matrix?
 0:32:41
Calculating the Variance Covariance Matrix using stock daily Prices in Python, R and Excel
 0:08:43
Constructing a Variance Covariance Matrix in Excel
 0:18:31
How To Calculate The Covariance Between X and Y - Statistics
Комментарии