filmov
tv
Create an Amazing Dashboard Using Tableau in 26 minutes| Amazon Prime Video
Показать описание
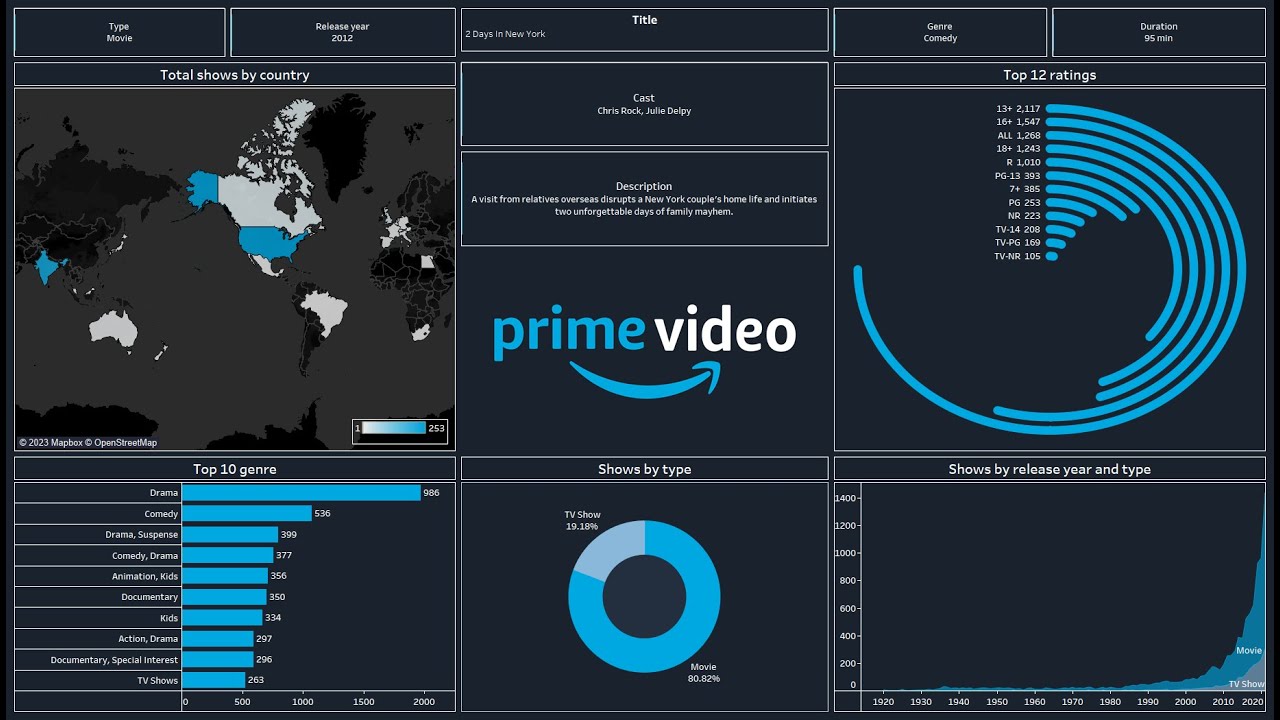
Create an Amazing Dashboard using Tableau in 26 minutes | Amazon Prime Video
Chapters:
(00:00) Introduction
(00:51) About the dataset
(02:25) Create Radial Bar Chart
(10:20) Create Donut Chart
(12:38) Create Area Chart
(14:29) Create Horizontal Bar Chart
(15:46) Create Map
(17:43) Create Text Sheets
(22:08) Create the dashboard
Prime video
Tableau for beginners
Tableau desktop
Amazon prime video movies
Amazon prime video shows
Amazon series
Amazon dashboard
data analysis
data analyst
data science
Netflix ratings
Data Science Road Map
Breaking Bad
Data Science Path:
Get certified from Google:
Get certified from Meta:
Disclosure:
I may receive a commission if you click on and purchase from one of the links above.
 0:19:12
Create an Amazing Power BI Dashboard in 19 minutes | Amazon Prime Movies and TV Shows
 0:22:13
Create an Amazing Dashboard Using Tableau in 22 minutes| Goodreads
 0:26:16
Create an Amazing Dashboard Using Tableau in 26 minutes| Amazon Prime Video
 0:01:04
I Create Dashboard in One Minute using Python | Python for beginners | #python #coding #programming
 0:15:43
Create an Amazing Dashboard Using Tableau in 15 minutes| Friends Series
 0:22:33
Create an Amazing Dashboard Using Tableau in 22 minutes| IMDb rating | Top 1000 movies
 0:04:56
Building a BEAUTIFUL Dashboard Was Never Easier
 0:09:51
12 Dashboard design tips for better data visualization
 0:05:22
Wrike Dashboards 2.0
 0:10:57
How to Create a Beautiful Python Visualization Dashboard With Panel/Hvplot
 0:23:37
Create an Amazing Power BI Dashboard in 23 minutes | FIFA World Cup
 0:06:09
4 x AI Dashboard Designs in 60 SECONDS!
 0:11:31
Make an AWESOME Tableau Dashboard in Only 10 Minutes
 0:19:30
Create an Amazing Power BI Dashboard in 19 minutes | Netflix Movies and TV Shows
 0:29:58
Create Netflix dashboard with Tableau in 30 minutes
 0:37:26
Excel Dashboard for Schools with changing students images dynamically | Full Tutorial + Voiceover
 0:36:52
Create an Amazing Dashboard Using Tableau in 36 minutes| UEFA Champions League
 0:11:43
How to Create Dashboard in Excel ☑️
 0:20:12
Ultimate Step by Step Google Looker Studio Dashboard Project | End to End Dashboard Project Tutorial
 0:30:37
How to build Dynamic & Interactive Dashboard in EXCEL with Pivot Tables&Charts | Tutorial Ep...
 0:05:36
How to Create a Dashboard in Google Sheets in 5 Minutes - 2024 Edition 📈
 0:30:35
Create an Amazing Interactive Tableau Dashboard in 30 Minutes | Amazon Sales in India
 0:15:10
How to create Power BI Dashboard (Report) in 7 Minutes in Power BI Desktop | @PavanLalwani
 0:40:32
Create interactive excel dashboard in 5 simple steps #exceldashboard #exceltutorial #pivottable
Комментарии