filmov
tv
Descriptive Statistics Test Solved, Frequency Tables, Measures of Center and Dispersion

Показать описание
1. Explain the difference between a population and a sample. 00:00:36
2. [stat1] statistics consists of organizing and summarizing information collected, while [stat2] statistics uses methods that generalize results obtained from a sample to the population and measure the reliability of the results. 00:00:57
3. True or False. The following is a designed experiment.
A study is conducted to determine if there is a relationship between brain cancer and use of cell phones. Doctors ask patients with brain cancer about their use of cell phones. 00:01:43
4. What does single-blind and double-blind mean? 00:02:10
5. Create a bar graph for this data.
Copy and paste this into StatCrunch.
A A B OB A B ... 00:02:56
6. The following are the rates of return of FACEBOOK's stock. With a first class having a lower class limit of 0 and a class width of 0.5, construct a frequency distribution. (Hint: I am not asking for a histogram)
0.425, 2, 2, 1.15, ... 00:07:01
7. The following are the incomes of college grads. Create a frequency polygon of this data. Use a first lower class limit of 35,000, and a class width of 5,000.
39622, 39919, 40241, ... 00:11:53
8. Professor Kim graded an exam with 9 people in it. She found the average to be 86. She then noticed another exam was in her folder. This exam score was 72. What would the new average be? Show your work by using the equation editor, or inserting your work from excel or StatCrunch. 00:21:57
9. Based off of a Skewed right distribution determine if the mean or median is bigger. 00:25:38
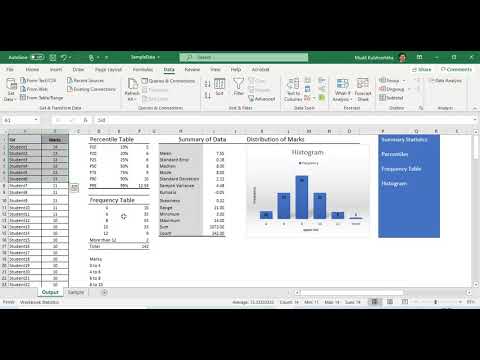
10. Match the summary statistics with the histogram.
11. The average age of Covid-19 cases in June 2020 was 38 with a standard deviation of 12. Assuming that ages have a bell-shaped distribution, what percentage of people had ages between 26 and 50? (Round to the nearest percent) 00:27:05
12. The average age of Covid-19 cases in June 2020 was 38 with a standard deviation of 12. Assuming that ages have a bell-shaped distribution, 95% of ages of Covid-19 would be between which two ages? 00:29:24
13. The average number of home runs per year by baseball players is 13, with a standard deviation of 4. What percentage of players would have home runs between 3 standard deviations of the mean? (round to the nearest percent) 00:29:26
14. The average number of home runs per year by baseball players is 13, with a standard deviation of 4. What are the number of home runs that would b e within 3 standard deviations of the mean? 00:31:50
15. For this data, what would you use to estimate the center, and why?
320, 58.8, ... 00:31:57
16. For this data, what would you use to estimate the dispersion, and why? Note that this is the same data set as the previous question.
320, 58.8, ... 00:33:41
17. Check the following data set for an outlier. If there is an outlier, show why it is an outlier. Note, showing a boxplot will not be accepted for reasoning for an outlier if there is an outlier.
42, 43, ... 00:34:06
18.Find the average age of Covid-19 deaths.
Age of Covid-19 deaths Frequency
10-14 98
15-19 559
20-24 140
25-29 188
30-34 1111
35-39 1222
40-44 2322
45-49 800 00:37:56
2. [stat1] statistics consists of organizing and summarizing information collected, while [stat2] statistics uses methods that generalize results obtained from a sample to the population and measure the reliability of the results. 00:00:57
3. True or False. The following is a designed experiment.
A study is conducted to determine if there is a relationship between brain cancer and use of cell phones. Doctors ask patients with brain cancer about their use of cell phones. 00:01:43
4. What does single-blind and double-blind mean? 00:02:10
5. Create a bar graph for this data.
Copy and paste this into StatCrunch.
A A B OB A B ... 00:02:56
6. The following are the rates of return of FACEBOOK's stock. With a first class having a lower class limit of 0 and a class width of 0.5, construct a frequency distribution. (Hint: I am not asking for a histogram)
0.425, 2, 2, 1.15, ... 00:07:01
7. The following are the incomes of college grads. Create a frequency polygon of this data. Use a first lower class limit of 35,000, and a class width of 5,000.
39622, 39919, 40241, ... 00:11:53
8. Professor Kim graded an exam with 9 people in it. She found the average to be 86. She then noticed another exam was in her folder. This exam score was 72. What would the new average be? Show your work by using the equation editor, or inserting your work from excel or StatCrunch. 00:21:57
9. Based off of a Skewed right distribution determine if the mean or median is bigger. 00:25:38
10. Match the summary statistics with the histogram.
11. The average age of Covid-19 cases in June 2020 was 38 with a standard deviation of 12. Assuming that ages have a bell-shaped distribution, what percentage of people had ages between 26 and 50? (Round to the nearest percent) 00:27:05
12. The average age of Covid-19 cases in June 2020 was 38 with a standard deviation of 12. Assuming that ages have a bell-shaped distribution, 95% of ages of Covid-19 would be between which two ages? 00:29:24
13. The average number of home runs per year by baseball players is 13, with a standard deviation of 4. What percentage of players would have home runs between 3 standard deviations of the mean? (round to the nearest percent) 00:29:26
14. The average number of home runs per year by baseball players is 13, with a standard deviation of 4. What are the number of home runs that would b e within 3 standard deviations of the mean? 00:31:50
15. For this data, what would you use to estimate the center, and why?
320, 58.8, ... 00:31:57
16. For this data, what would you use to estimate the dispersion, and why? Note that this is the same data set as the previous question.
320, 58.8, ... 00:33:41
17. Check the following data set for an outlier. If there is an outlier, show why it is an outlier. Note, showing a boxplot will not be accepted for reasoning for an outlier if there is an outlier.
42, 43, ... 00:34:06
18.Find the average age of Covid-19 deaths.
Age of Covid-19 deaths Frequency
10-14 98
15-19 559
20-24 140
25-29 188
30-34 1111
35-39 1222
40-44 2322
45-49 800 00:37:56
 0:11:10
Descriptive Statistics [Simply explained]
 0:40:49
Descriptive Statistics Test Solved, Frequency Tables, Measures of Center and Dispersion
 0:13:25
Descriptive Statistics: FULL Tutorial - Mean, Median, Mode, Variance & SD (With Examples)
 0:01:00
Descriptive Statistics in Excel Mean, Median, Mode, Std. Deviation,...
 0:06:29
Frequencies and Descriptive Statistics
 0:01:48
Frequencies Analysis in SPSS
 0:05:36
Descriptive Statistics in Excel Using the Data Analysis Tool
 0:00:45
SPSS - Mean, Median, Mode, Standard Deviation & Range
 11:54:58
Statistics for data science using Python session 319
 0:14:34
Mean, Median, and Mode of Grouped Data & Frequency Distribution Tables Statistics
 4:15:27
Statistics - A Full Lecture to learn Data Science
 0:08:10
How To Perform Descriptive Statistics In Excel (Very Easy!)
 0:01:45
SPSS tutorial 5: How to do Descriptive Analysis
 0:07:20
Descriptive Statistics vs Inferential Statistics
 0:00:23
Mean median mode range
 0:00:42
What's the difference between mean, median, mode and range? Descriptive statistics explained
 0:42:09
Teach me STATISTICS in half an hour! Seriously.
 0:03:02
Descriptive Statistics - Mean & Standard Deviation
 1:34:23
QA { DESCRIPTIVE STATISTICS }
 0:06:11
DESCRIPTIVE STATISTICS R SOFTWARE
 0:28:06
CHAPTER 2: Summarizing Data Through Descriptive Statistics
 0:07:50
Statistics - Mean, Median & Mode for a grouped frequency data
 0:14:59
Statistics in Excel Tutorial 1.1. Descriptive Statistics using Microsoft Excel
 0:47:35
Stat 1490 Chapter 2: Descriptive Statistics
Комментарии