filmov
tv
Linear Regression: Time Series Analysis

Показать описание
Linear Regression: Time Series Analysis
Hi everyone! This is a quick and simple Time Series: Linear Regression analysis - Output interpretation in Eviews. Learn how to estimate a simple linear regression and how to interpret the linear regression output results - how to estimate and interpret ols!
Summary of the video: Using real GDP data for Argentina and Brazil, I show you how to estimate a linear regression in eviews and how to interpret the regression estimation output. Estimate the linear regression yourself and obtain the linear regression results by downloading the data in the description. I hope you enjoy it!
📈 Download the dataset for free and replicate the content of the video:
✅ Visit my website to see all my FREE tutorials:
☕️ If you value my content and would like to show a recognition, you can make a donation:
---------------------------------------------------------------------------------------------------------
🕘 Timestamps:
🎬 In this video the following analysis is performed:
👋 Video introduction 0:00
📊 (i)How to estimate linear regression in Eviews 1:05
📊 (ii)How to interpret eviews regression output: 1:53
📊 (ii)Regression residuals: 11:30
---------------------------------------------------------------------------------------------------------
🎬 More EViews related videos:
---------------------------------------------------------------------------------------------------------
Doubts or comments? Please leave your comment and I will be pleased to provide you an answer.
👍 Like and subscribe for more videos!
🛎If you would like to contact me for research purposes, or work related issues, please feel to send me a message at:
---------------------------------------------------------------------------------------------------------
Thanks!
 0:02:34
Linear Regression in 2 minutes
 0:06:28
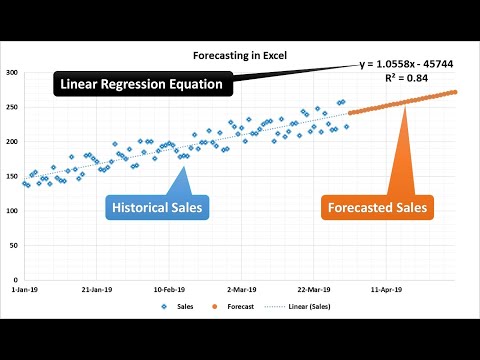
Linear Regression in Excel for Time Series Data
 0:07:29
What is Time Series Analysis?
 0:12:57
Linear Regression: Time Series Analysis
 0:24:59
Time Series Forecasting with Regression Model
 0:13:29
Video 1: Introduction to Simple Linear Regression
 0:12:23
Using Linear Regression in Excel for Time Series Forecasting
 0:03:00
Introducing Time Series Analysis and forecasting
 0:26:41
REGRESSION MODELING || DATA ANALYTICS || LECTURE 01 BY DR. NEHA SINGH || AKGEC
 0:42:47
Wooldridge Econometrics for Economics BSc students Ch. 10: Regression Analysis with Time Series Data
 0:12:44
Forecasting in Excel using Linear Regression
 0:04:48
Regression 1: Regression for forecasting
 0:11:09
Time Series Vs Non Time Series Problems- Why Time Series Forecasting Is Difficult?
 0:23:21
Lecture 10. Time series forecasting with Multiple Linear Regression
 0:07:38
Vector Auto Regression : Time Series Talk
 0:08:54
Time Series Talk : Autoregressive Model
 0:15:05
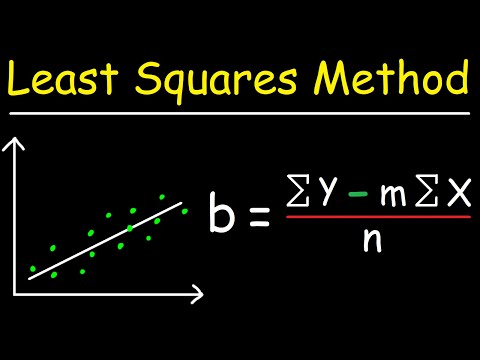
Linear Regression Using Least Squares Method - Line of Best Fit Equation
 1:16:19
8. Time Series Analysis I
 0:09:38
Regression Analysis: An introduction to Linear and Logistic Regression
 0:07:42
MLfT 1 : Wk 3.2.1 - ARIMA compared to linear regression
 0:23:09
Time Series Forecasting with XGBoost - Use python and machine learning to predict energy consumption
 1:22:13
6. Regression Analysis
 0:06:22
5.1: Time series regression models introduction
 0:05:18
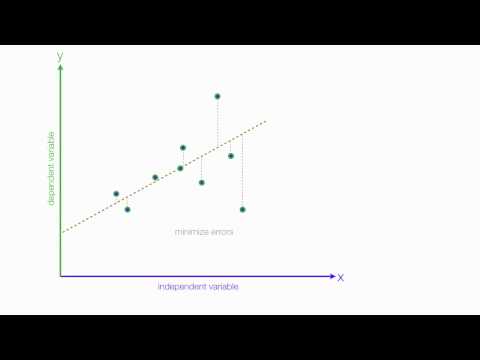
An Introduction to Linear Regression Analysis
Комментарии