filmov
tv
110 - Visualizing COVID-19 cases & death information using Python and plotly

Показать описание
This video describes the process of reading an actively developing COVID-19 data set into Python and plotting the data many ways for easy analysis.
References:
Thanks to the blog article by Mr. Santiago.
References:
Thanks to the blog article by Mr. Santiago.
 0:20:59
110 - Visualizing COVID-19 cases & death information using Python and plotly
 0:04:06
Coronavirus Data Extraction & Visualization (COVID-19)
 0:08:25
111 - What are the top 10 countries with highest COVID-19 cases and deaths?
 0:12:16
COVID19 Data analysis with Python
 2:31:42
Covid-19 Data Analysis Project using Python| Covid-19 Data Analysis
 0:13:45
🔴Covid-19 Data Analysis Project Using Python | Dash WebApp With Live Tracking Part-1| Plotly Library...
 0:03:59
Portugal Covid-19 (+ vaccine) Report (2021-110-17)
 0:19:07
107 - Analysis of COVID-19 data using Python - Part 1
 0:13:17
2020 July 22 Coronavirus Community Update v32 Recording
 0:16:28
COVID-19: Presentation In Children and When To Open Schools
 0:31:37
Building COVID-19 interactive dashboard from Jupyter Notebook | No frontend/backend coding required.
 0:00:47
MapmyIndia COVID - 19 Dashboard
 0:03:14
Coronavirus Cases per 1,000,000 People - Top 50 Countries!
 0:02:04
Covid-19 Pandemic Worldwide Confirmed Cases Time-lapse Map
 0:06:44
COVID 19 STATISTICS DASHBOARD PYTHON
 0:01:07
VERIFY: DSHS issues warning about misleading chart comparing flu, COVID-19 stats
 0:00:48
Covid-19 Time Lapse - Active Cases (per capita) with Daily Deaths 3D Overlay - Jan 22 to Aug 24
 0:09:13
COVID Python Data App Part I: Pandas
 1:57:01
Covid-19 evidence session: statistical resources
 0:22:51
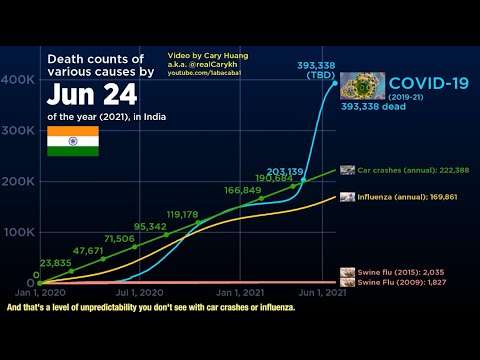
COVID-19 2021Jun24 update. Final COVID19 video, I’ve retired! (Data-viz source code now open-source)...
 0:17:35
Data Analysis of Kerala Covid Cases: Application of Python data visualization packages: Part-1
 0:04:45
COVID-19 | Week 17 starts: Graphs tell that the virus exponential growth has slowed down a bit
 0:03:46
A look back at 2020: Tracking the critical moments of the COVID-19 pandemic
 0:23:16
COVID 19 Trend Analysis March 30, 2020
Комментарии