filmov
tv
Read the Tape Like a Pro: Timing Entries with Level 2 Data

Показать описание
Read the Tape Like a Pro: Timing Entries with Level 2 Data
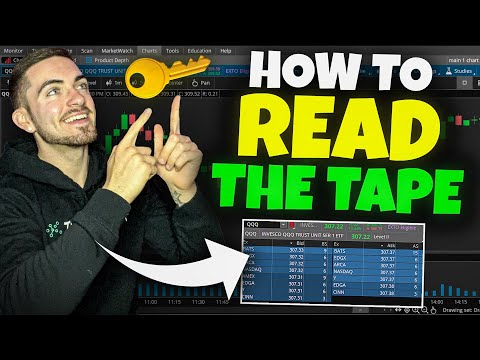
NEW: Tape Reading Level 2. Learning to read the tape is an old-school trading strategy that still works to buy the right stocks. Today we discuss Level two, time and sales, bid ask quotes and how we use tape reading on price carts to identify order flow.
Introduction (0:00 - 1:18)
Pete introduces the concept of "tape reading"
Overview of the topics covered: understanding order flow, timing stock entries, and how stocks move
Explaining Level 1 & 2 Data (1:18 - 4:30)
Definition of Level 1 (bid/ask prices) and Level 2 (depth of market data)
Meaning of colored "prints" (trades) in Level 2
Interpreting Order Flow (4:30 - 8:20)
Active buying (green prints) vs. active selling (red prints)
Yellow prints and indecision
How orders from big players ("deep pockets") move stocks
Reading the Tape on Charts (8:20 - 16:50)
Translating order flow to candlestick charts
Identifying bullish vs bearish order flow
Signs of changing order flow (indecision candles)
Practical Applications (16:50 - 18:11)
Using order flow to find entries
Managing risk by following the "smart money"
Joining Pete's trading community
Section Summaries:
Introduction (0:00 - 1:18)
Learn an old-school "tape reading" technique to understand order flow - the driving force behind stock movements. Discover when to buy stocks by analyzing the actions of large, institutional players.
Explaining Level 1 & 2 Data (1:18 - 4:30)
Dive into Level 1 (best bid/ask) and Level 2 (full order book) stock data. Understand the color coding of trades and what the different "prints" signify for order flow.
Interpreting Order Flow (4:30 - 8:20)
Decipher the market's order flow by reading Level 2 quotes. Green prints reveal eager buying, while red prints show aggressive selling. Yellow prints hint at shifting dynamics.
Reading the Tape on Charts (8:20 - 16:50)
Translate raw Level 2 order flow onto candlestick charts. Identify bullish vs bearish flow through price patterns. Spot potential reversals with indecision candles signaling a tape change.
Practical Applications (16:50 - 18:11)
Apply tape reading to find optimal entry points by piggybacking on institutional order flow. Manage risk by staying aligned with the "smart money" until signs of distribution emerge.
💰Watch Now: How I Generate Outsized Gains💰
💰Pete Renzulli | Stock Trading Pro 💰
Join us Monday's 7:30 AM: Stocks For Breakfast
Be sure to SUBSCRIBE to the channel and hit the LIKE button for updates. #peterenzulli #stocktradingpro #stocks
Stock Trading Pro and Pete Renzulli may receive compensation for recommending these high-quality products and services from these 3rd-parties that we trust.
Contact:
Disclaimer:
#stockmarket #beststockstobuynow #stockstobuy #stockpicks #tsla #stockmarketnews
These YouTube stock market live stream videos are for financial education purposes. It's up to you to consult your financial advisor to make the final decision before you decide which stocks to buy
 0:18:47
Read the Tape Like a Pro: Timing Entries with Level 2 Data
 0:17:48
How to Read Level 2 Time and Sales, Tape Reading - Day Trading for Beginners 2024
 0:07:58
How To Read The Tape (Level 2 & Time & Sales Tutorial)
 0:04:24
How to read a tape measure without looking like an idiot
 0:09:17
How to Read a Tape Measure Like a PRO
 0:04:34
Beginner's Guide: How to Read a Metric Tape Measure Step-by-Step
 0:06:28
How To Read The Tape for Day Trading | Learn Tape Reading With These Drills! 👌🏻🙏
 0:03:20
How to Read a Tape Measure - REALLY EASY
 1:48:41
LEARN HOW TO READ THE TAPE | LIVE TRADING US STOCK MARKET USING ICT SMART MONEY CONCEPTS 2/DEC/24
 0:11:23
How to Read The Tape For Better Trades | LIVE Day Trade
 0:04:24
How To Read A Tape Measure Like A Pro!
 0:10:06
How To Read The Tape for Day Trading | Level 2 and Time & Sales
 0:12:58
ALL TAPE MEASURE TRICKS Explained...In Just 13 Minutes! (Measuring Tape Pro TIPS, TRICKS + ADVICE!)
 0:09:00
Tape measure pro tips, Most homeowners don't know this
 0:12:59
Level Up Your Day Trading: Tape Reading Tactics for Any Market
 1:01:34
Level 2 Trading Secrets (How to Read the Tape Using Time & Sales)
 0:00:23
How to read a tape measure.
 0:34:48
How to Use Tape Reading to Make Quick Profitable Trades (for Scalping)
 0:11:43
117 - How to Read a Tape Measure Like a Boss
 0:12:49
How to read a tape measure : Tips for reading a tape faster
 0:18:42
Tape Reading 101 || Level 2 and Time & Sales
 0:00:17
How to read a measuring tape for sewing #sewing #diy #how
 0:14:12
How to Read the Tape and Level 2 | The #1 Indicator for Trading Success | Day Trading 101
 0:01:00
Trading a stock short using the tape (reading the tape) #daytrading #stockmarket #level2
Комментарии