filmov
tv
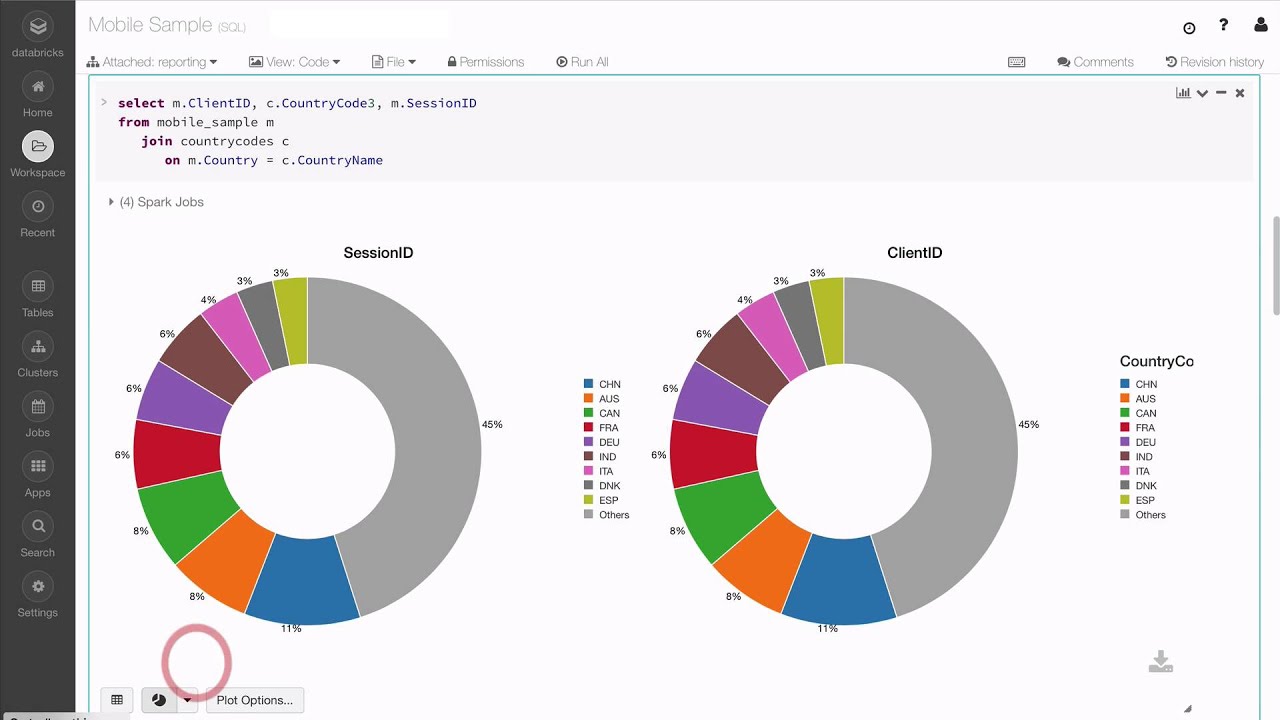
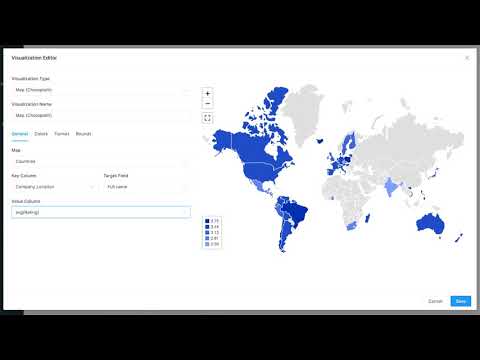
Visualizations in Databricks
Показать описание
Learn how to visualize your data on the Databricks platform. Databricks can create detailed charts with a single click and also supports popular third-party libraries such as ggplot, d3, and matplotlib so that you can create your own custom visualizations.
About: Databricks provides a unified data analytics platform, powered by Apache Spark™, that accelerates innovation by unifying data science, engineering and business.
Connect with us:
About: Databricks provides a unified data analytics platform, powered by Apache Spark™, that accelerates innovation by unifying data science, engineering and business.
Connect with us:
 0:02:02
Visualizations in Databricks
 0:04:51
How to build #AIBI #Dashboard in #Databricks #datanalytics #visualization
 0:30:17
Using Databricks to Power Insights and Visualizations on the S&P Global Marketplace
 0:02:00
Databricks SQL Editor Visualizations
 0:01:54
Databricks New AI Powered Visualization Tool
 0:27:09
Databricks Dashboards Made Easy – Create Interactive Visualizations in Minutes
 0:04:59
Databricks - Easy SQL Analytics Visualizations
 0:01:47
AI/BI Dashboards Embedding - A tutorial
 0:13:00
Day 11: Create Dashboard From Databricks Notebook | 30 Days of Databricks
 0:03:52
Data Exploration with Databricks
 0:26:44
Portable Scalable Data Visualization Techniques for Apache Spark and Python Notebook-based Analytics
 0:01:30
Importing count() Data for Visualizations in Bokeh Using Databricks
 0:06:34
AI/BI: Intelligent Analytics for Real-World Data
 0:25:09
Advancing Spark - Advanced Visuals in Databricks SQL Analytics
 0:30:08
Using Tableau to Analyze Your Data Lake
 0:00:13
End-to-End Azure ETL | SQL➡️ADLS with ADF, Databricks, Synapse & Power BI | Beginner + Intermedi...
 0:03:51
Databricks Data Engineering in 5 Minutes
 0:59:21
Azure Databricks = Azure + Spark + Machine Learning
 0:00:15
Real Time Power BI Project, Blinkit Analysis #powerbi #powerbidashboard #dataanalyst
 0:06:24
Data Import and Exploratory Analysis (2/5)
 0:06:50
Databricks SQL Demo
 0:20:26
Databricks Notebooks: Code Free Visualization with Python, R, Scala, and SQL
 0:34:31
Building Spatial Applications with Apache Spark and CARTO
 0:27:41
Social Media, Spark, Machine Learning, and Data Visualization to Find Patterns and Insight
Комментарии